Price at 196.51 sits only 1.90% above the rising 200-SMA (192.86), which has acted as the structural floor and is the key line defending the long bias. The MACD has crossed above its signal line while still near zero, indicating a fresh momentum shift before the move is extended, and RSI at 42.96 leaves ample room to expand upward before hitting overbought conditions. The 50-SMA at 208.98 is the immediate overhead magnet and the primary resistance to reclaim, with the gap between price and that level defining the swing opportunity.
Monday Playbook — Top 5 Setups
The day's five highest-conviction setups, ranked by technical inflection, profit-probability, and trade quality — 4 long, 1 short. Trade your plan and manage risk first. Also screened: $ALGN, $AMZN, $RDDT, $META, $IGV, $SPY.
Inflection60
Probability83
Quality92
NVDA is coiling just above its 200-SMA (192.86) while trading below the 50-SMA (208.98), setting up a classic mean-reversion inflection with a bullish MACD cross (0.02 vs -0.09) suggesting momentum is rotating higher from a neutral RSI of 42.96.
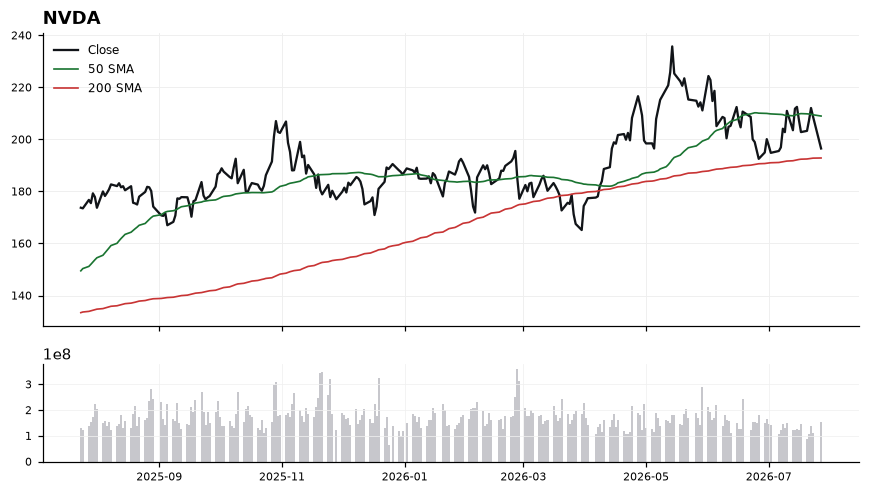
EntryPreferred accumulation zone 193.50–197.00 on hold of the 200-SMA (192.86); confirmation add on a reclaim and close above 200.00 with MACD extension.
InvalidationDaily close below 190.00 invalidates the setup — it would breach the 200-SMA (192.86) and flip the intermediate structure, negating the bullish MACD cross.
TargetsFirst target 208.98 (50-SMA reversion / trend resistance). → Second target 215.00–218.00 on a 50-SMA reclaim with RSI push toward 60.
TimeframeSwing (2-6 weeks)
Inflection69
Probability64
Quality93
GOOGL sits at 326.56, just 0.81% above the rising 200-SMA at 323.94 — a textbook mean-reversion test after a pullback from the 50-SMA at 364.84. With RSI(14) at 36.83, price is approaching oversold territory precisely where structural support lives, creating a defined inflection for the working long bias.
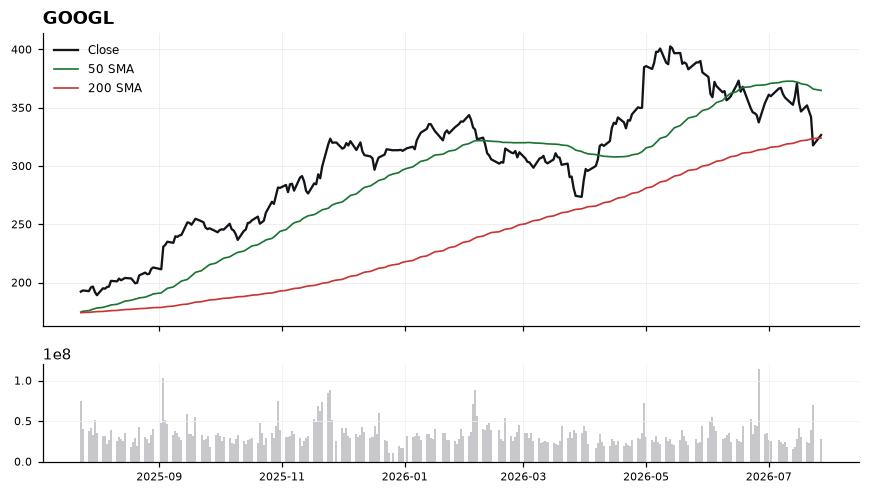
The tape shows two conflicting signals: price is below the 50-SMA (364.84) with MACD negative at -7.55 and still under its signal line at -4.18, confirming active downside momentum. However, RSI at 36.83 is not yet washed out and price is holding the 200-SMA (323.94), which has been the operative long-term trend anchor. The 0.81% cushion to the 200-SMA is thin — this is the decision line where dip-buyers must defend, or the trend structure weakens toward a full retest of lower ground.
EntryAccumulation zone 324.00–328.00, aligned with the 200-SMA shelf; preferred trigger is a reclaim of 330.00 on a daily close with MACD histogram narrowing.
InvalidationDaily close below 320.00 invalidates the setup — it would breach the 200-SMA (323.94) and signal the long-term trend support has failed, opening downside continuation.
TargetsFirst target 348.00 — prior consolidation and midpoint back toward the 50-SMA → Second target 364.00 — direct retest of the 50-SMA at 364.84
TimeframeSwing (2-6 weeks)
Inflection64
Probability75
Quality85
HIMS is coiling just below both its 50-SMA (30.34) and 200-SMA (31.07), with price at 30.24 sitting -2.66% under the long-term trend line — a classic inflection where a failed reclaim would confirm the short bias.
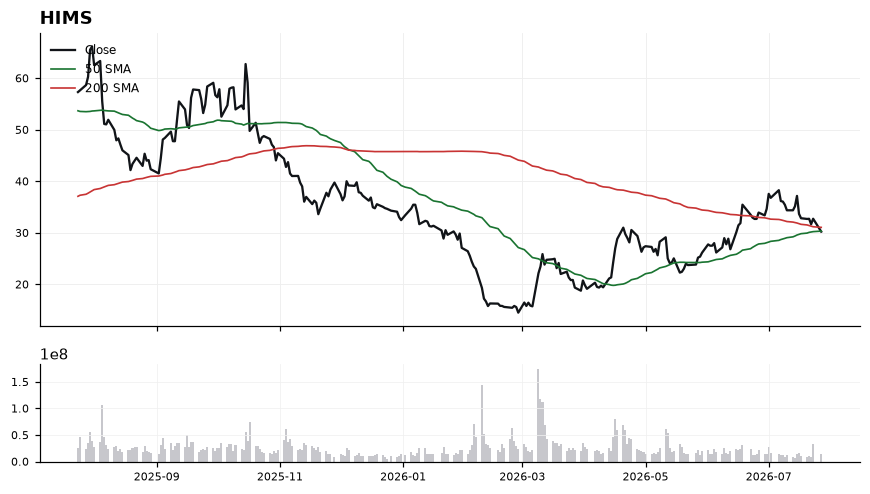
The stack is bearish: price trades beneath the 50-SMA (30.34) which itself sits below the 200-SMA (31.07), signaling a nascent death-cross posture. RSI at 41.71 is sub-50 but not oversold, leaving room to work lower before capitulation. MACD at 0.17 vs signal 0.97 shows momentum has decisively rolled over, with the histogram deeply negative. The -2.66% gap to the 200-SMA defines the immediate overhead ceiling that shorts must defend.
EntryFade strength into the 30.34 (50-SMA) to 31.07 (200-SMA) resistance shelf; preferred trigger is a rejection candle in the 30.30–31.00 zone, or a momentum entry on a break below 30.00 round-number support.
InvalidationInvalidation on a daily close above 31.30 — breaking the 200-SMA reclaim would flip the moving-average stack and neutralize the MACD bearish cross, invalidating the short thesis.
TargetsFirst target 29.00 — prior demand zone and a clean ~4% move that would push RSI toward oversold → Second target 27.75 — extension objective that opens after 29.00 fails to hold as support
TimeframeSwing (2-4 weeks)
Inflection69
Probability64
Quality90
QCOM is testing its rising 200-day SMA at 169.16 after a deep pullback from the 50-day at 203.09, creating a classic mean-reversion inflection where price sits just 0.52% above long-term trend support.
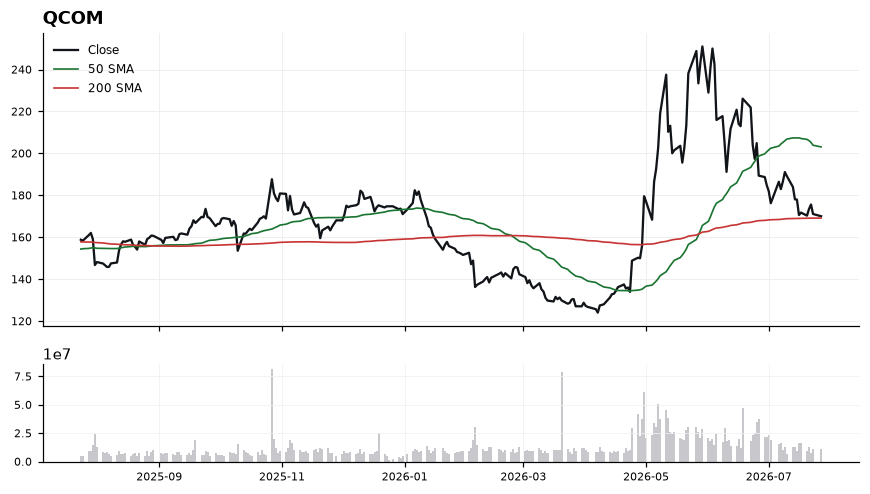
Price at 170.04 hugs the 200-SMA (169.16) while trading roughly 16% below the 50-SMA (203.09), signaling a stretched but stabilizing tape. RSI at 38.47 is in oversold territory without yet turning up, and MACD at -8.33 remains below its signal at -7.94, so momentum has decelerated but not confirmed a cross. The tight gap between MACD and signal suggests a bullish crossover is within reach if buyers defend the 200-day, making this a make-or-break zone for the intermediate uptrend.
EntryAccumulate 169.50-172.00 on a hold of the 200-SMA (169.16); add on a reclaim/close above 175.00 with MACD crossing its signal line
InvalidationDaily close below 165.00 invalidates the 200-SMA support thesis and opens risk of a full trend break toward the 160 handle
TargetsFirst target 185.00 (gap-fill / mid-range between the SMAs) → Second target 203.00 near the 50-SMA resistance
TimeframeSwing (2-6 weeks)
Inflection51
Probability83
Quality87
AVGO is coiling between its rising 200-SMA (364.94) and downward-sloping 50-SMA (399.37), setting up a classic mean-reversion inflection where price at 383.22 sits roughly 5% above long-term trend support while attempting to reclaim intermediate resistance.
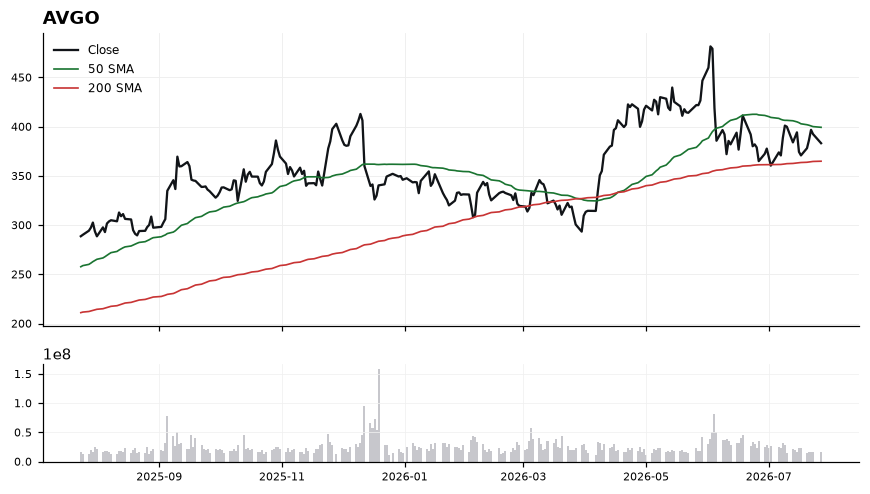
The tape holds constructive posture above the 200-SMA, preserving the longer uptrend, while the 50-SMA at 399.37 caps rallies and defines the immediate hurdle. RSI at 48.29 is neutral with room to expand before overbought, and MACD at -1.70 above its signal at -3.39 signals momentum is turning up from negative territory — an early bullish crossover setup. Net read: base-building phase, with buyers defending the 200-day and momentum inflecting higher, but confirmation requires a 50-SMA reclaim.
EntryAccumulation zone 378-385 on constructive holds above the 200-SMA; add-on trigger on a decisive close above 399.50 (50-SMA reclaim).
InvalidationDaily close below 364.94 (200-SMA); a break there voids the long-term uptrend structure and flips distance-to-trend negative, negating the long bias.
TargetsFirst target 399-405 at the 50-SMA convergence (prior resistance reclaim) → Second target 420-425 on momentum extension following a confirmed MACD cross and 50-SMA breakout
TimeframeSwing (3-6 weeks)
Ranked by technical inflection, profit-probability, and trade quality. Educational only. Not financial advice.