Price sits only 0.90% above the 200-SMA and comfortably above the rising 50-SMA at 605.19, confirming a bullish medium-term structure. RSI at 56.76 is constructive but not overbought, leaving room to extend, while MACD at 18.53 over its 12.53 signal shows momentum expanding to the upside. The narrow gap to the 200-day is the tell: sustained closes above 640 validate the reclaim, but the zone remains a decision point given trade-quality at 93 and inflection at 63.7.
Monday Playbook — Top 5 Setups
The day's five highest-conviction setups, ranked by technical inflection, profit-probability, and trade quality — 5 long, 0 short. Trade your plan and manage risk first. Also screened: $W, $ETOR, $HPQ, $ALGN, $AMZN, $HIMS.
Inflection64
Probability83
Quality93
META is a MAG7 long-bias setup trading at 645.85, holding just above its 200-SMA (640.06) after reclaiming trend — a classic inflection where the 200-day flips from resistance to potential support.
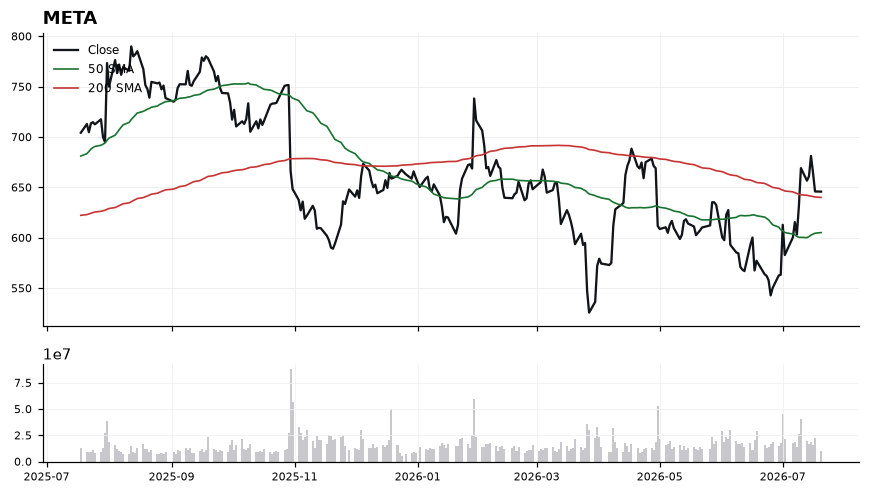
EntryAccumulation zone 640.06–646.00 on pullbacks that hold the 200-SMA; momentum trigger on a daily close above 650.
InvalidationDaily close below 620.00 invalidates the reclaim thesis, signaling the 200-SMA has failed as support and opening a retest of the 50-SMA at 605.19.
TargetsFirst target 675.00 as initial extension off the 200-SMA reclaim → Second target 705.00 on continuation with MACD holding above signal
TimeframeSwing (2-6 weeks)
Inflection56
Probability83
Quality88
AVGO is consolidating between its rising 200-SMA (363.87) and declining 50-SMA (402.00), sitting 3.93% above long-term trend support. With MACD (-4.47) curling above its signal (-5.14) and RSI at a neutral 46.74, the setup is at an inflection where a reclaim of the 50-SMA would resolve the range higher.
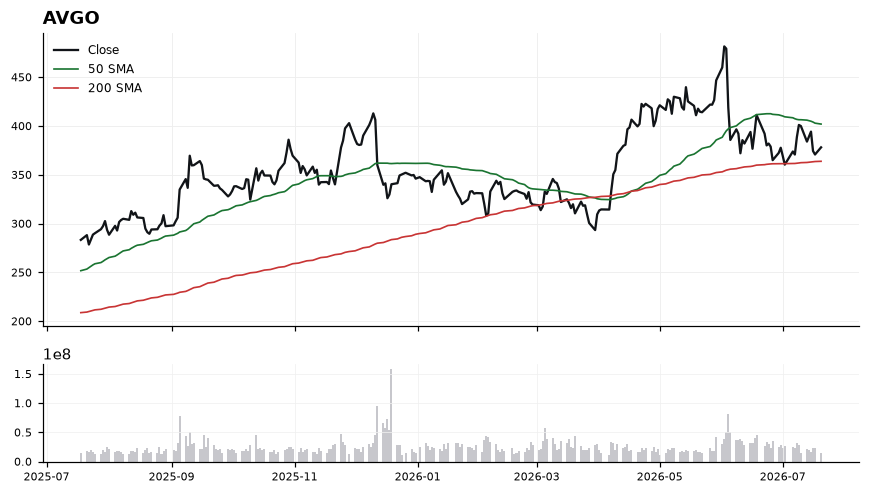
Price at 378.16 remains below the 50-SMA (402.00) but constructively above the 200-SMA (363.87), preserving the primary uptrend. The MACD cross-up from deeply negative territory suggests downside momentum is fading, while RSI near 47 leaves ample room to run before overbought conditions. The 363.87 zone is the critical demand shelf; failure there would break the long-term structure, whereas reclaiming 402 opens the path back toward prior highs.
EntryAccumulate on strength 380-385 with confirmation trigger on a daily close above 388; alternatively, pullback entries near 368-372 close to the 200-SMA offer better risk/reward.
InvalidationDaily close below 360 invalidates the thesis — this breaks the 200-SMA and signals a structural trend failure rather than a routine pullback.
TargetsFirst target 402 at the 50-SMA, where sellers previously emerged → Second target 418-425 on a decisive reclaim and momentum extension
TimeframeSwing (2-6 weeks)
Inflection68
Probability69
Quality87
RDDT is pinned within pennies of its 200-day SMA (181.52) at 181.64, testing the pivot that separates a longer-term downtrend from a fresh uptrend — an inflection line where the trade quality score (86.6) argues for asymmetric setup potential.
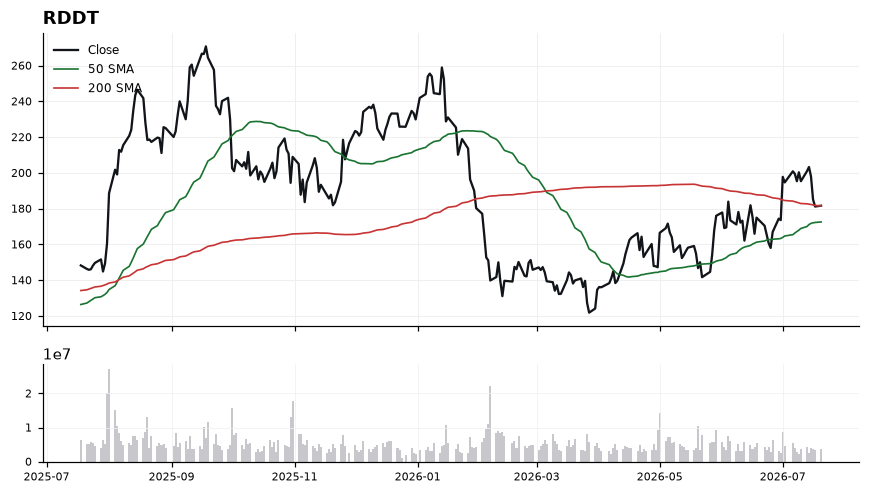
Price sits 0.07% above the 200-SMA (181.52) and comfortably above the rising 50-SMA (172.55), a bullish medium-term structure now confronting long-term resistance. RSI(14) at 48.76 is neutral, leaving room to expand upward without being stretched. However, MACD at 5.19 is still below its signal (7.09), signaling near-term momentum deceleration that must reconcile with price holding the 200-SMA. Reclaim-and-hold above 181.52 is the tell; failure would return the tape to the 172.55/50-SMA zone.
EntryStage entries on a confirmed hold above the 200-SMA: initial tranche 181.50–183.00; add on strength through 184.50 with MACD curl back toward signal.
InvalidationClosing break below 177.00 invalidates the reclaim thesis; a decisive move under 172.55 (50-SMA) would signal the inflection has failed and the broader base needs to re-form.
Targets188.50 — first extension above the 200-SMA reclaim zone → 195.00 — measured continuation if MACD crosses back above signal
TimeframeSwing (2-6 weeks)
Inflection69
Probability64
Quality90
QCOM is testing its 200-day SMA (169.07) from above, with price at 170.32 sitting just 0.74% over that long-term trend line — a classic decision point where trend either reasserts or breaks. The working long bias hinges on this pivot holding, supported by an oversold-leaning RSI of 37.4 that hints at seller exhaustion near key support.
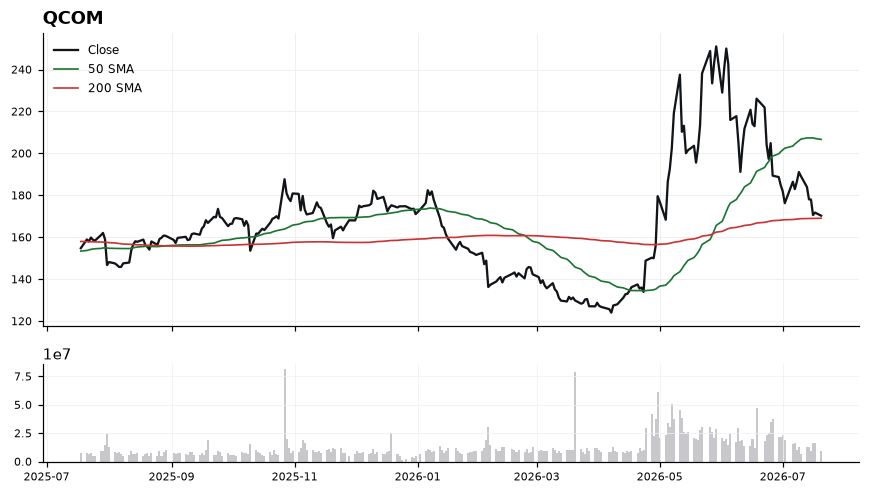
Price is caught between two very different regimes: it trades roughly 17.6% below the 50-SMA at 206.68 (confirming a clear intermediate downtrend) yet is knife-edge above the 200-SMA at 169.07, which now defines the entire long thesis. RSI at 37.4 signals fading downside momentum without yet flipping bullish, while MACD at -8.79 remains below its signal (-7.27), indicating momentum has not yet turned — the negative histogram is the primary caution flag. Trade-quality (90.1) and inflection (68.5) scores are constructive, but confirmation requires the 200-SMA to hold and MACD to begin narrowing versus its signal line.
EntryStaged accumulation zone 169.50–171.00 on a hold of the 200-SMA (169.07); add-on trigger on a reclaim of 175.00 with MACD crossing back above its signal line.
InvalidationDaily close below 165.50 (roughly 2% under the 200-SMA). A break there invalidates the inflection thesis, confirms loss of the long-term trend anchor, and opens risk toward prior demand well below current levels.
TargetsFirst target 184.00–186.00 — mean-reversion toward the midpoint of the gap between price and the 50-SMA. → Second target 205.00–207.00 — retest of the 50-SMA (206.68) where trend resistance is expected.
TimeframeSwing (2-6 weeks)
Inflection48
Probability83
Quality90
NVDA is coiling between its 50-SMA (209.82) resistance and 200-SMA (192.48) support, trading at 203.28 with a trade-quality score of 89.9 that flags a high-grade setup despite a middling inflection score of 48.3. The tape sits at a decision point: MACD (-0.02 vs signal -0.85) has crossed higher while RSI at 48.62 is neutral, suggesting momentum is turning before price has confirmed.
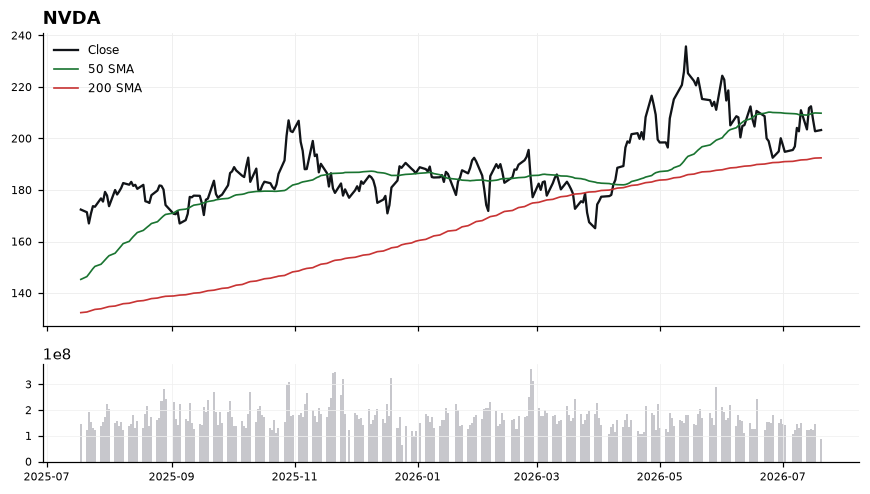
Price is 5.61% above the 200-SMA at 192.48, keeping the longer-term uptrend structurally intact, while the 50-SMA at 209.82 now caps the tape as the immediate ceiling. The MACD differential of +0.83 above signal marks a bullish momentum crossover from depressed levels, yet RSI at 48.62 confirms no trend thrust has begun — this is early-stage repair, not breakout. A reclaim of 209.82 would flip the short-term trend; failure there re-exposes the 192-200 shelf. Profit-probability of 83.0 supports the long lean, but the muted inflection score argues for staged entry, not chasing.
EntryPrimary accumulation zone 199.00-203.50 (current price area near the mid-range). Add-on trigger on a decisive close above the 50-SMA at 209.82.
InvalidationDaily close below 191.50 (just under the 200-SMA at 192.48). Breaking this invalidates the long-term uptrend structure and would signal a shift from consolidation to distribution.
TargetsFirst target 209.82 — the 50-SMA, where sellers are most likely to defend → Second target 218.00-220.00 — measured move above reclaimed 50-SMA on momentum continuation
TimeframeSwing (2-6 weeks)
Ranked by technical inflection, profit-probability, and trade quality. Educational only. Not financial advice.