Price at 374.45 is wedged between overhead resistance at the 50-SMA (404.08) and structural support at the 200-SMA (363.41), keeping the medium-term uptrend intact but the short-term tape corrective. RSI at 44.97 is neutral-to-soft, leaving room to run before any overbought constraint, while MACD at -3.59 above its signal at -5.52 confirms downside momentum is decelerating and turning higher. The narrow 3.04% cushion to the 200-SMA is the pivotal line: holding it preserves the long thesis; losing it flips the character of the trend. Scores (inflection 60, profit-probability 83, trade-quality 88.6) support a constructive but disciplined long stance.
Thursday Playbook — Top 5 Setups
The day's five highest-conviction setups, ranked by technical inflection, profit-probability, and trade quality — 4 long, 0 short. Trade your plan and manage risk first. Also screened: $HD, $RDDT, $SPY, $AMZN, $ETOR, $NVDA.
Inflection60
Probability83
Quality89
AVGO is testing its role as a semis leader after a pullback that has price sitting just 3.04% above the rising 200-SMA (363.41) while trading below the 50-SMA (404.08) — a classic mean-reversion inflection where trend support meets a fading downswing.
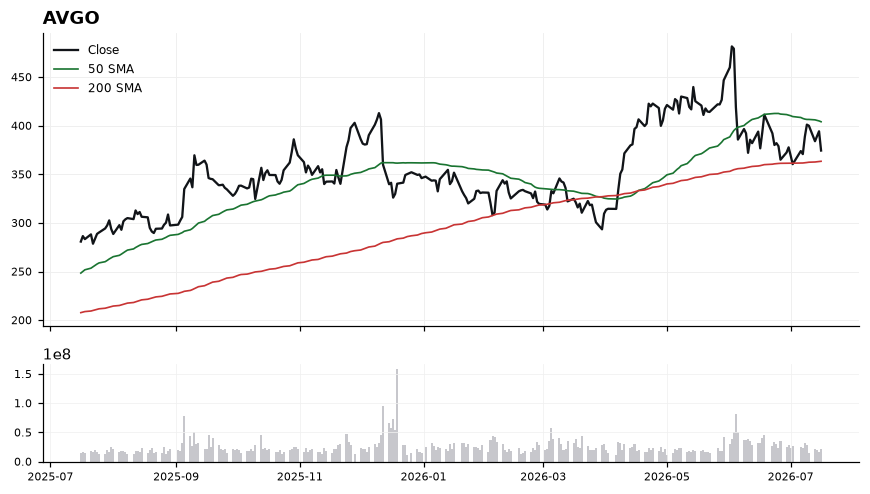
EntryStage entries: initial tranche 372–376 on stabilization near current price, add-on trigger on a reclaim of 385 that confirms MACD crossover follow-through.
InvalidationDaily close below 361 (just under the 200-SMA at 363.41) — a break there invalidates the trend-support thesis and signals a regime shift from pullback to breakdown.
TargetsFirst target 404 at the 50-SMA, where prior distribution is likely to cap the first leg. → Second target 420–425 on a decisive 50-SMA reclaim, opening the path back toward recent highs.
TimeframeSwing (2-6 weeks)
Inflection58
Probability83
Quality91
META trades at 664.54, holding above both the 50-SMA (603.71) and 200-SMA (640.99) with a Long working bias. The reclaim of the 200-day and MACD expansion (19.90 vs 8.96 signal) mark an active momentum inflection, while trade-quality (91.2) and profit-probability (83.0) scores reinforce the constructive setup.
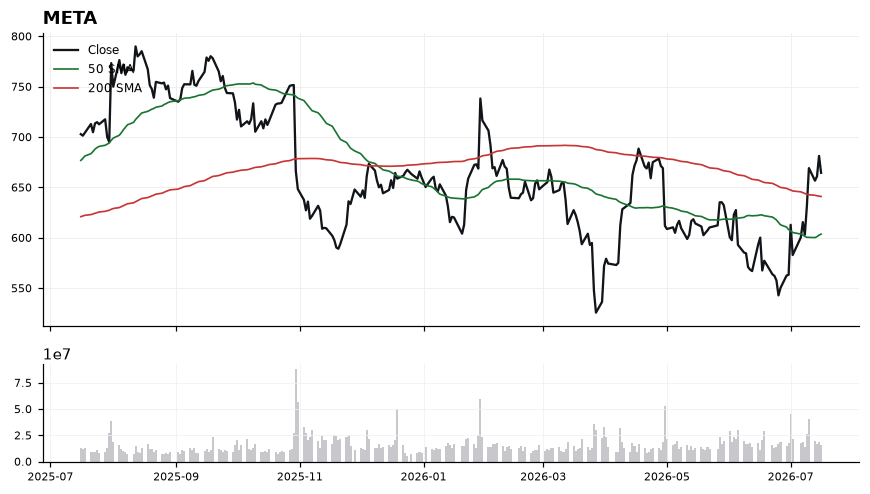
Price sits 3.67% above the rising 200-SMA and roughly 10% above the 50-SMA, confirming a re-established uptrend structure. RSI at 61.83 is firmly bullish but not yet overbought, leaving room before momentum exhaustion. MACD at 19.90 versus signal 8.96 shows a wide, expanding spread — a classic trend-continuation signature. The 640.99 (200-SMA) and 603.71 (50-SMA) act as tiered support beneath spot.
EntryPreferred entry on pullback into 655–645 (retest of prior breakout shelf toward the 200-SMA at 640.99); alternatively, momentum add on a clean daily close above 670.
InvalidationInvalidation on a decisive daily close below 640.00 — that would break the 200-SMA reclaim, neutralize the MACD thrust, and shift the bias back to range/mean-reversion toward the 50-SMA at 603.71.
TargetsFirst target 690.00 — measured extension from the 200-SMA reclaim and prior swing resistance zone → Second target 715.00 — trend-continuation objective if RSI holds >60 and MACD spread remains positive
TimeframeSwing (2-6 weeks)
Inflection68
Probability64
Quality90
QCOM is testing its 200-day SMA (169.02) from above with price at 170.61, a classic long-side inflection zone where a semiconductor pullback either finds support or breaks trend. With RSI at 37.21 (approaching oversold) and price sitting just 0.94% above the 200-day, the tape is compressed for a decision.
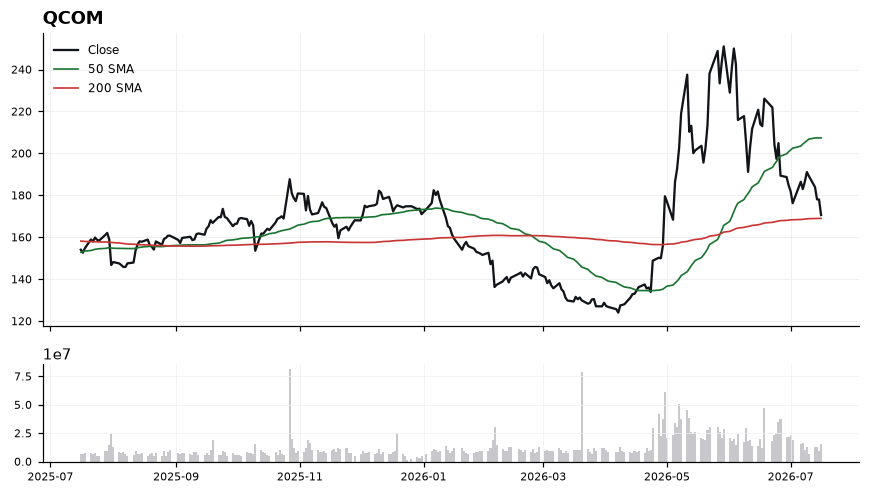
Price at 170.61 is trading well below the 50-SMA (207.42), confirming a corrective leg inside a longer uptrend still defined by the rising 200-SMA at 169.02. MACD at -8.08 versus signal -6.50 shows momentum is still negative and has not yet crossed up, so downside energy has not fully exhausted. However, RSI at 37.21 signals stretched-but-not-broken conditions, and the razor-thin 0.94% cushion to the 200-SMA makes this the highest-probability reaction zone on the chart. A defended hold of 169 flips the read constructive; a clean loss opens air beneath the trend.
EntryStagger longs in the 169.50-171.50 reaction zone against the 200-SMA; add on a reclaim/close back above 172.50 with MACD curling toward its signal line.
InvalidationDaily close below 165.50 (roughly 2% under the 200-SMA). A break there invalidates the 200-day support thesis and signals trend transition, not just a pullback.
TargetsFirst target 188.00 — mid-gap fill between price and the 50-SMA → Second target 207.00 — retest of the 50-SMA at 207.42
TimeframeSwing (2-6 weeks)
Inflection40
Probability98
Quality82
HPQ trades at 24.14, holding constructively above both its 50-SMA (23.58) and 200-SMA (22.51) with a fresh MACD positive cross (0.15 vs 0.01 signal) suggesting momentum is re-accelerating from a neutral base.
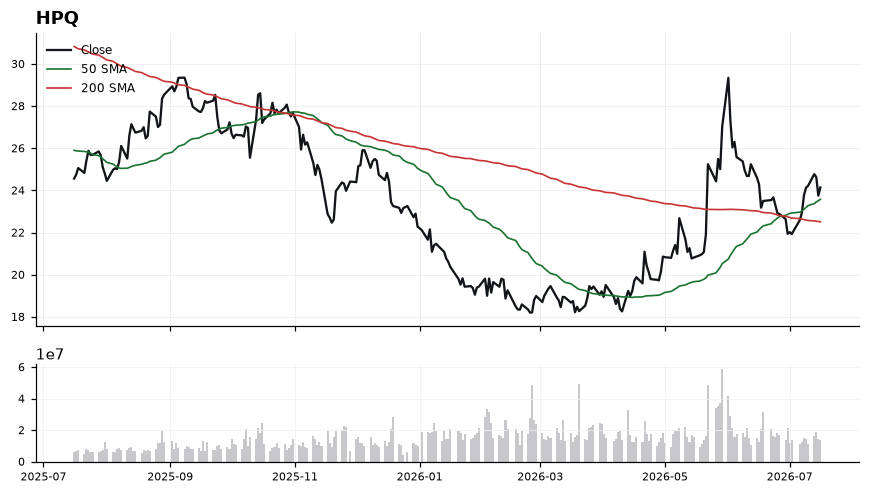
Price sits 7.24% above the rising 200-SMA and roughly 2.4% above the 50-SMA, confirming a stacked bullish moving-average structure. RSI at 54.12 is mid-range, leaving room to expand upward before overbought conditions emerge near 70. The MACD spread (0.14 above signal) has just turned decisively positive, historically a lead indicator when combined with a reclaim of the 50-SMA. Trade-quality (81.8) and profit-probability (98.0) are strong, but inflection score (39.6) suggests the setup is mid-move rather than at a fresh breakout pivot.
EntryPreferred accumulation on pullbacks into the 23.60–23.85 zone (retest of the 50-SMA); breakout add-on above 24.40 on expanding momentum.
InvalidationClosing break below 22.95 invalidates the thesis — it would signal loss of the 50-SMA shelf and open a retest of the 200-SMA near 22.51.
Targets25.20 — prior swing resistance and first measured extension → 26.40 — secondary target aligned with ~17% distance to 200-SMA
TimeframeSwing (2-6 weeks)
Inflection64
Probability75
Quality74
MDB is coiling just beneath its converging 50-SMA (332.48) and 200-SMA (333.77) at 328.60, a classic inflection zone where a reclaim would flip the trend structure while rejection extends the base.
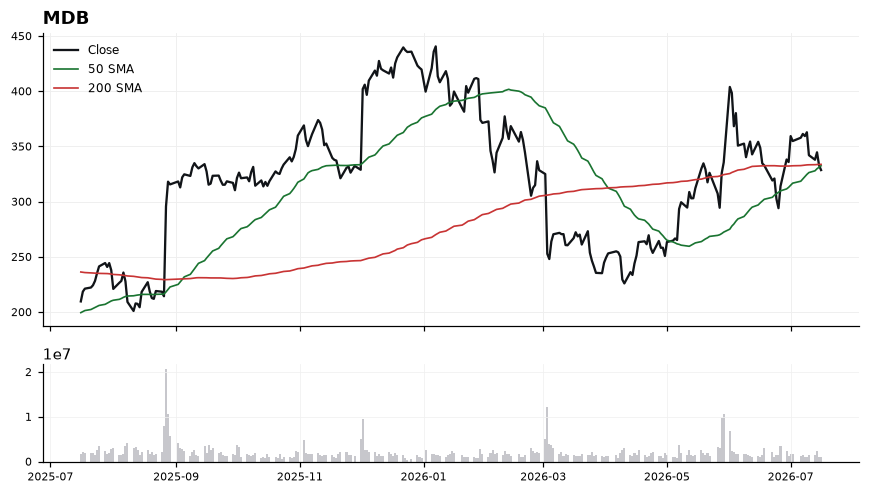
Price sits 1.55% below the 200-SMA with the 50-SMA now tucked under the 200-SMA, signaling an unresolved intermediate downtrend. RSI at 46.14 is neutral-soft but curling off oversold territory, suggesting momentum is stabilizing rather than accelerating. MACD at 2.56 remains below its signal at 4.95, confirming near-term momentum is still fading even as absolute values stay positive. The tight 1.3-point gap between the two SMAs creates a defined battleground: a decisive move through 333.77 unlocks trend repair, while failure keeps sellers in control.
EntryWatch for a reclaim and hold above 333.77 (200-SMA) as the primary trigger; a more aggressive starter zone sits on a pullback to 324-326 that holds with RSI turning up.
InvalidationInvalidation on a daily close below 322.00; breaking this voids the base-building thesis and opens air beneath the coiled SMAs.
TargetsFirst target 342.50 (reclaim of prior swing shelf above the SMA cluster) → Second target 352.00 (measured extension once MACD crosses back above signal)
TimeframeSwing (2-6 weeks)
Ranked by technical inflection, profit-probability, and trade quality. Educational only. Not financial advice.