Price sits 16.1% below the 50-SMA (203.90) but only marginally above the 200-SMA (169.15), signaling a deep pullback within a still-intact secular uptrend. RSI at 39.07 is subdued but not oversold, leaving room for a mean-reversion push higher, while MACD at -8.34 vs signal -7.84 confirms downside momentum is still in force and has not yet crossed. The trade-quality score of 89.8 and technical-inflection of 65.8 reflect an attractive risk-defined setup, but the negative MACD spread argues for waiting on confirmation rather than pre-empting the turn.
Sunday Playbook — Top 5 Setups
The day's five highest-conviction setups, ranked by technical inflection, profit-probability, and trade quality — 3 long, 2 short. Trade your plan and manage risk first. Also screened: $ALGN, $META, $ETOR, $HPQ, $AVGO, $RDDT.
Inflection66
Probability64
Quality90
QCOM is testing its 200-day SMA (169.15) from above with price at 171.11, a classic inflection where the long-term trend line either reasserts as support or gives way. The working long bias hinges on this ~1.16% cushion holding while momentum stabilizes.
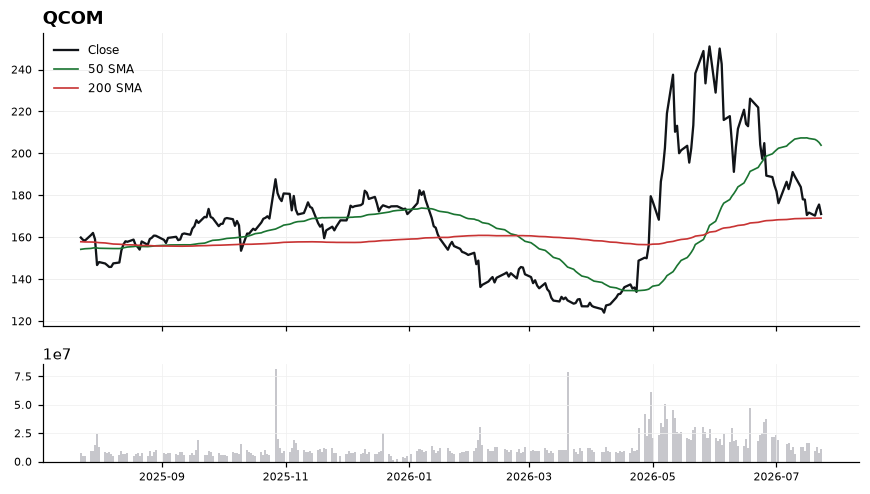
EntryStage entries on a reclaim/hold of 171.50-173.00 with MACD curling toward its signal line; a secondary add zone sits at 169.50-170.00 on a controlled retest of the 200-SMA.
InvalidationDaily close below 166.50 invalidates the thesis — it would mark a decisive loss of the 200-SMA (169.15) and open the path to trend-follow selling with no nearby technical floor.
TargetsFirst target 184.00-186.00, prior consolidation shelf and mean-reversion zone → Second target 195.00-198.00, approach to the declining 50-SMA at 203.90
TimeframeSwing (2-6 weeks)
Inflection66
Probability69
Quality80
HOOD is trading at 101.58, hovering just 0.65% above its 200-SMA (100.92) and well above its 50-SMA (94.99), placing price at a decision point where the long-term trend line is being retested from above.
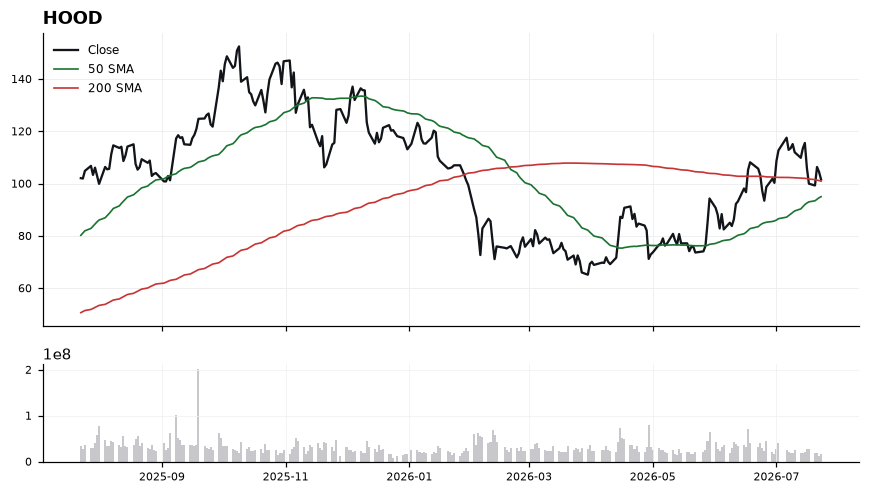
The stack is constructive with the 50-SMA (94.99) below spot but the 200-SMA (100.92) acting as immediate support, keeping the long bias intact only while price holds that line. RSI at 48.20 sits in neutral territory, leaving room to expand higher without overbought risk, but MACD at 2.10 has crossed below its signal at 4.03, signaling near-term momentum deceleration. The combination argues for a pullback-to-support setup rather than a breakout chase, with the 100.92 zone the pivotal line separating trend continuation from a deeper mean-reversion toward the 50-SMA.
EntryPreferred accumulation zone 100.90-102.00, aligning entries with the 200-SMA retest; alternative confirmation trigger on a reclaim and hourly close back above 103.00 with MACD curling toward its signal.
InvalidationDaily close below 98.50 invalidates the setup, as it would break the 200-SMA support decisively and open a path back toward the 50-SMA at 94.99.
Targets108.50 — first resistance and momentum objective on RSI expansion toward 60 → 114.00 — extension target if MACD re-crosses above signal and trend resumes
TimeframeSwing (2-6 weeks)
Inflection63
Probability69
Quality86
RH is coiling just above its rising 50-SMA (154.01) and reclaiming the 200-SMA (163.82) at 166.08, marking an inflection where trend structure turns constructive but momentum has yet to confirm.
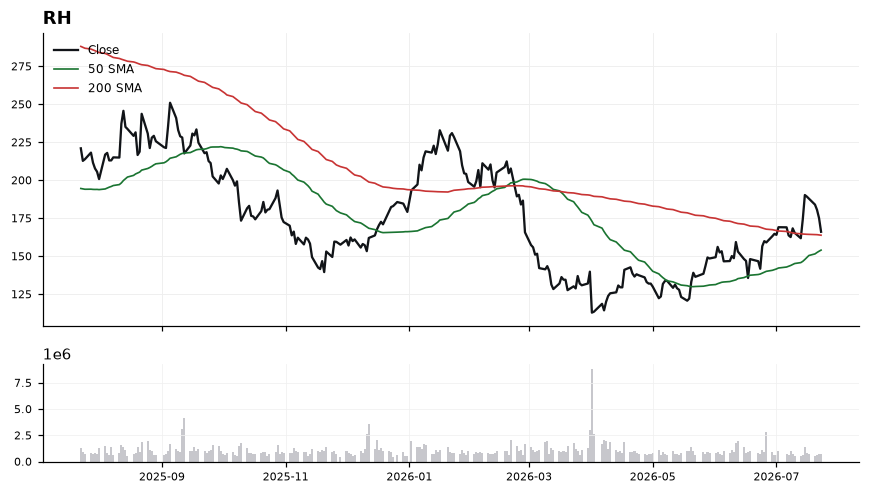
Price sits only 1.38% above the 200-SMA, with the 50-SMA below at 154.01, framing a widening long-term base. RSI at 49.28 is mid-range and neutral, leaving room to run before overbought conditions, while MACD at 7.08 sits just under its 7.93 signal — a modest bearish cross that signals hesitation, not breakdown. The setup favors buyers only on a decisive push through the 200-SMA shelf; failure to hold above it flips the tape back into the prior range.
EntryPrefer staged entries on either a reclaim/hold above 166.50–168.00 with MACD curling back over signal, or a pullback into the 163.80–164.50 zone (200-SMA retest) that holds.
InvalidationDaily close below 160.00 invalidates the reclaim thesis, implying rejection at the 200-SMA and a likely revisit of the 154 (50-SMA) area.
Targets172.50 — near-term extension above the current base → 180.00 — measured continuation on MACD reassertion and RSI push toward 60+
TimeframeSwing (2–6 weeks)
Inflection69
Probability56
Quality93
AMZN is pinned against its 200-SMA (234.53) with price at 233.66, sitting just 0.37% below the long-term trend line after rolling over from the 50-SMA at 249.90. With MACD (-0.53) beneath its signal (-0.23) and RSI at 38.62, the setup is at a decision point where a failed retest of the 200-SMA aligns with the working short bias.
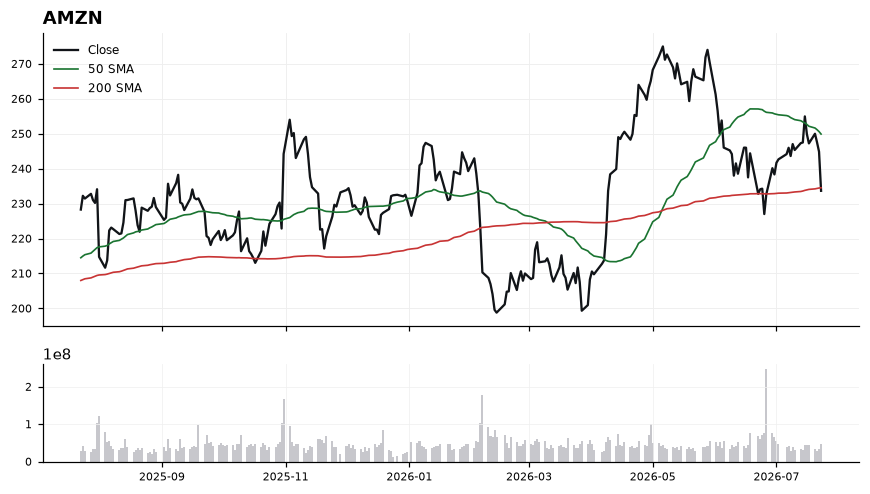
Price has lost the 50-SMA and is now testing the 200-SMA from below, converting former support into pivot resistance around 234.53. MACD remains negative and expanding away from signal, confirming downside momentum, while RSI at 38.62 is weak but not yet oversold — leaving room for further downside before exhaustion. The 50-SMA at 249.90 sits ~7% overhead, framing a clear bearish trend structure as long as rallies fail below the 200-SMA.
EntryShort into strength on a failed reclaim of the 200-SMA: sell zone 234.50–236.50, with an aggressive add on a breakdown trigger below 232.50.
InvalidationInvalidation on a daily close above 238.50; breaking that level would signal the 200-SMA is reclaimed as support and neutralize the short thesis, opening room back toward the 50-SMA.
TargetsFirst target 226.00 (measured move from the 200-SMA rejection) → Second target 218.50 (extension zone if momentum accelerates)
TimeframeSwing (2-6 weeks)
Inflection69
Probability56
Quality92
GOOGL is testing a critical inflection zone, sitting just 1.81% below its 200-SMA at 323.56 after breaking down from the 50-SMA at 366.06. With trade-quality scoring 92.4, the setup offers a defined short bias against overhead resistance, but oversold RSI warns against chasing here.
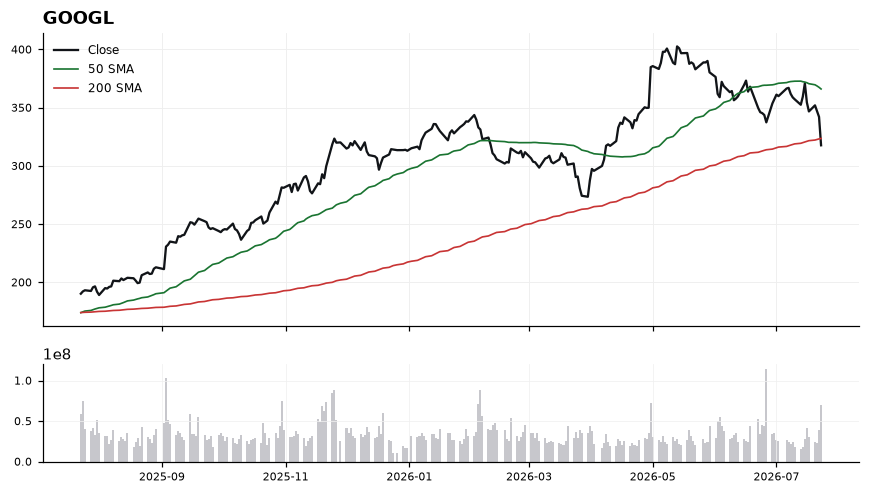
Price at 317.69 is trading below both the 50-SMA (366.06) and 200-SMA (323.56), confirming a bearish trend structure with the 200-SMA now flipped to resistance. MACD at -6.33 versus signal -3.34 shows accelerating downside momentum as the histogram widens. However, RSI(14) at 31.02 sits at the oversold threshold, raising the probability of a mean-reversion bounce back toward the 323.56 breakdown level before trend continuation. The 48-point gap between price and the 50-SMA underscores how stretched the tape is to the downside.
EntryPreferred short re-entry on a retest of the 200-SMA at 323.56, with a secondary trigger on rejection near 328-330. Avoid initiating fresh shorts at 317.69 given oversold RSI.
InvalidationInvalidation on a daily close above 332.00; a reclaim of the 200-SMA on strong momentum would neutralize the bearish thesis and open the door to a squeeze back toward the 50-SMA.
TargetsFirst target: 308.00 (prior demand shelf and measured extension from the 200-SMA rejection) → Second target: 298.50 (round-number magnet extending the current MACD-driven leg lower)
TimeframeSwing (2-4 weeks)
Ranked by technical inflection, profit-probability, and trade quality. Educational only. Not financial advice.