Price at 242.67 trades below the 50-SMA (255.42) but holds a constructive buffer over the 200-SMA (232.98), keeping the primary uptrend intact. RSI at 48.70 is neutral and turning up from mid-range, while MACD at -4.39 has crossed above its signal (-5.30), signaling early momentum repair after a pullback. The 50-SMA now acts as immediate overhead resistance, and reclaiming it would flip the intermediate structure back to bullish; failure to do so keeps the tape range-bound between 233 and 255.
Monday Playbook — Top 5 Setups
The day's five highest-conviction setups, ranked by technical inflection, profit-probability, and trade quality — 3 long, 1 short. Trade your plan and manage risk first. Also screened: $ANET, $GOOGL, $META, $TSM, $ASML, $ORCL.
Inflection53
Probability83
Quality91
AMZN is coiling between its rising 200-SMA (232.98) and a declining 50-SMA (255.42), sitting 4.16% above the long-term trend — a classic mean-reversion inflection where the working long bias needs confirmation from momentum before committing size.
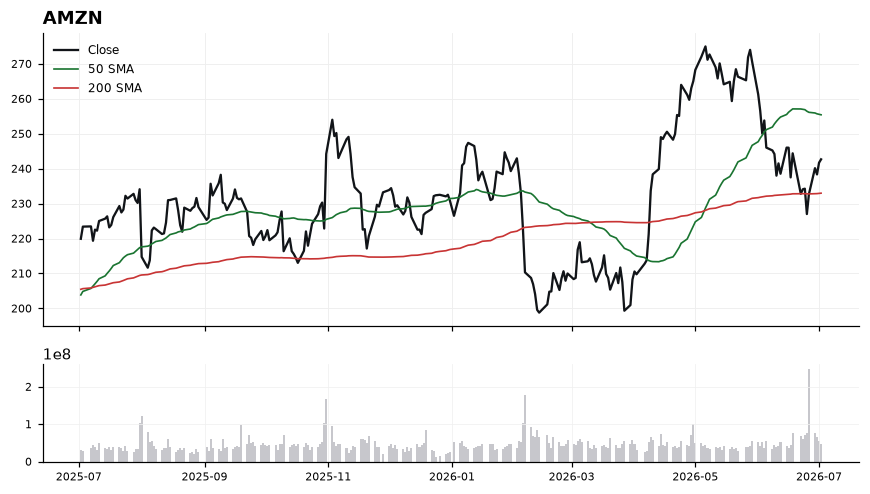
EntryAccumulation zone 240–244 with confirmation trigger on a reclaim of 248 (prior pivot); more aggressive add on a decisive break above the 50-SMA at 255.42.
InvalidationDaily close below 232.98 (200-SMA) invalidates the long thesis — it would break the primary trend and open risk toward the low-220s.
TargetsFirst target 255.42 at the 50-SMA confluence → Second target 265–268 on a successful 50-SMA reclaim and RSI push above 60
TimeframeSwing (2-6 weeks)
Inflection61
Probability69
Quality92
NVDA is coiling just above its rising 200-SMA at 191.03 while trading below the 50-SMA at 209.80, setting up a classic mean-reversion inflection where the long-term trend support is being retested for the first time in this pullback. With trade-quality scoring 92.3 and profit-probability at 69.0, the risk/reward geometry is compressing into a decision zone.
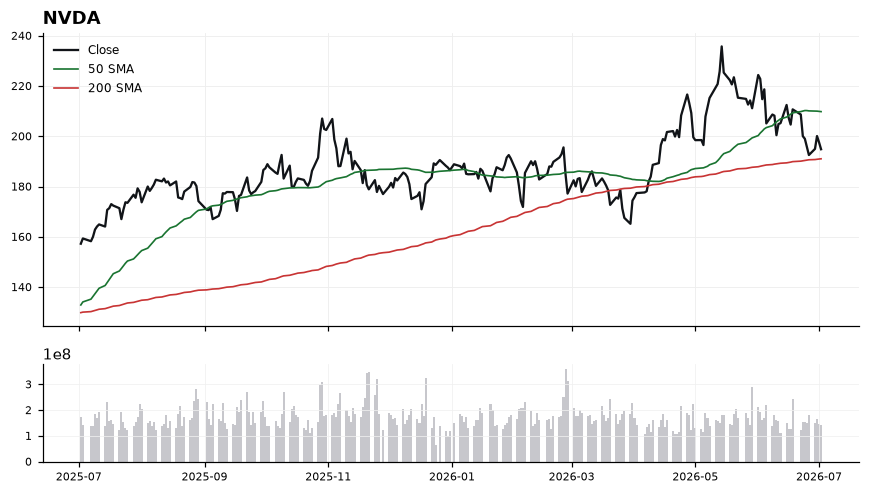
Price at 194.83 sits only 1.99% above the 200-SMA (191.03), the key structural line that has anchored the broader uptrend. RSI at 41.16 is subdued but not oversold, indicating momentum has flushed without capitulation, while MACD at -4.09 vs signal -3.09 remains negative and still widening — a short-term drag that has yet to inflect. The 50-SMA at 209.80 now acts as overhead resistance roughly 7.7% above spot, framing a defined reclaim path if buyers defend the 200-SMA shelf.
EntryStaged accumulation between 191.50–195.00 (200-SMA reclaim zone), with a confirmation add on a daily close back above 200.00 that would signal MACD histogram compression.
InvalidationDaily close below 188.00 (roughly 1.6% under the 200-SMA); losing this level breaks the long-term trend support and invalidates the mean-reversion long thesis, opening a deeper de-rating.
TargetsFirst target 209.80 — retest of the 50-SMA and gap-fill resistance (~7.7% upside). → Second target 218.00–220.00 — reclaim of prior distribution range, contingent on MACD bullish cross.
TimeframeSwing (2-6 weeks)
Inflection69
Probability56
Quality90
AVGO is pinned at its 200-day SMA (361.45) with price at 360.45, sitting just 0.28% below this key long-term trend line after slipping from well above the 50-SMA at 409.43. The tape is at an inflection: a decisive rejection or reclaim of the 200-SMA will likely dictate the next multi-week leg.
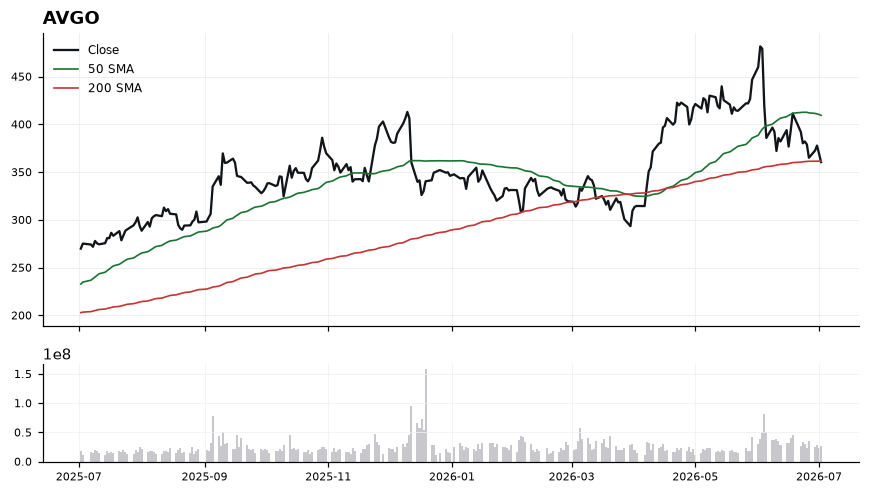
Price trades below both the 50-SMA (409.43) and 200-SMA (361.45), confirming a deteriorating trend structure with the 50 well above the 200 but price already breaking down through both. RSI at 39.63 is weak but not yet oversold, leaving room for further downside before mean-reversion pressure builds. MACD at -11.74 versus signal -9.28 shows a bearish crossover with momentum still expanding to the downside. The -0.28% distance to the 200-SMA marks this as the pivotal battleground — closes back above 361.45 would neutralize the short thesis quickly.
EntryShort trigger on a confirmed rejection at the 200-SMA: fade rallies into 361.45–365.00, or add on a breakdown close below 358.00 that flips the 200-SMA into resistance.
InvalidationInvalidation on a daily close above 370.00, which would reclaim the 200-SMA with conviction and neutralize the MACD bearish cross, signaling short thesis failure.
TargetsFirst target 345.00, a measured move below the 200-SMA where RSI would likely reach oversold → Second target 328.00–330.00, extending the down-leg toward prior structural support
TimeframeSwing (2-6 weeks)
Inflection54
Probability64
Quality88
QCOM trades at 176.25, roughly 4.7% above its rising 200-SMA (168.36) but well below the 50-SMA (202.48), creating a classic pullback-to-trend inflection where the long-term uptrend is being retested from above.
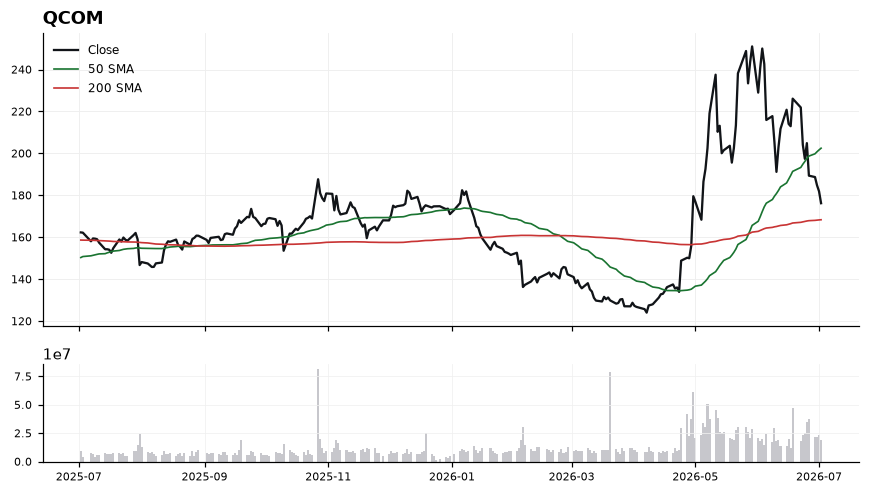
The 50-SMA over 200-SMA structure remains constructive, but momentum has decisively rolled over: RSI(14) at 38.13 sits in weak territory yet not oversold, and MACD at -6.81 versus signal -1.65 confirms downside momentum is still expanding. Price is compressing between overhead supply near the 50-SMA at 202.48 and the 200-SMA support shelf at 168.36, a ~34-point band that defines the risk/reward map. Until MACD tightens back toward its signal line and RSI reclaims the 45-50 zone, this is a stalking setup rather than a confirmed turn.
EntryPrefer a staged accumulation on tests of the 170-172 zone with confirmation (reclaim of 176.25 on closing basis); an alternative trigger is a daily close back above 182 signaling momentum inflection.
InvalidationDaily close below 166 (beneath the 200-SMA at 168.36); losing that level breaks the long-term trend anchor and invalidates the pullback-to-support thesis.
Targets188-192 as first mean-reversion objective toward the mid-range gap → 202-205 zone at the 50-SMA (202.48) where trend supply is likely to cap
TimeframeSwing (2-6 weeks)
Inflection48
Probability61
Quality90
TSLA is trading at 393.45, sitting 3.2% below its 50-SMA (406.42) and 6.01% below its 200-SMA (418.61), with a golden-cross setup fractured but momentum quietly repairing. With RSI at 46.77 (neutral) and MACD (-1.63) crossed above its signal (-3.29), the tape is inflecting from downside momentum toward a reclaim attempt of the 50-day.
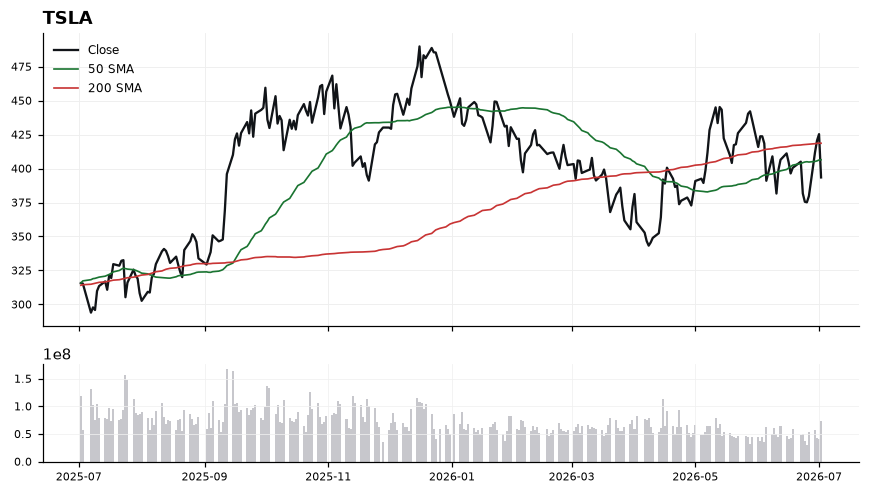
Price action is pinned between a rising MACD histogram (bullish divergence from oversold conditions) and a still-declining stack of moving averages, with the 50-SMA (406.42) acting as first overhead resistance and the 200-SMA (418.61) as the structural line in the sand. RSI at 46.77 gives room to run in either direction without being stretched, but the sub-200-day posture (-6.01%) keeps the working bias as Watch rather than accumulate. Trade-quality scores well (89.6) while technical-inflection is only mid-tier (48.3), signaling a high-caliber name but an unconfirmed turn. The setup needs a decisive reclaim of the 50-SMA to convert MACD improvement into trend follow-through.
EntryTier 1 trigger: reclaim and hourly close above 406.50 (50-SMA) to confirm momentum shift. Tier 2 (aggressive): pullback tag of 388-390 with MACD holding above signal.
InvalidationInvalidation on a daily close below 385.00; breaking that level negates the MACD crossover, re-opens downside toward prior swing lows, and confirms the 50-SMA rejection.
TargetsFirst target: 418.60 — mean reversion to the 200-SMA and primary supply zone → Second target: 430.00 — extension above the 200-day, unlocking trend re-engagement
TimeframeSwing (2-6 weeks)
Ranked by technical inflection, profit-probability, and trade quality. Educational only. Not financial advice.