Price at 172.46 sits essentially on the 50-day and just 4.35% above the 200-day, framing a tight decision zone between short- and long-term trend proxies. RSI at 45.78 is neutral-soft, indicating buyers have not yet regained control, while MACD at 0.54 below its 1.48 signal line confirms a fading short-term impulse. The bullish tell is that despite this momentum cooling, price refuses to lose the 50-SMA — a constructive base-building tape rather than a breakdown.
Wednesday Playbook — Top 5 Setups
The day's five highest-conviction setups, ranked by technical inflection, profit-probability, and trade quality — 5 long, 0 short. Trade your plan and manage risk first. Also screened: $RDDT, $SPY, $RH, $IGV, $HOOD, $GOOGL.
Inflection55
Probability84
Quality84
ALGN is coiling right at its 50-SMA (172.20) while holding above the rising 200-SMA (165.27), a classic inflection where trend structure remains intact but momentum has yet to re-engage.
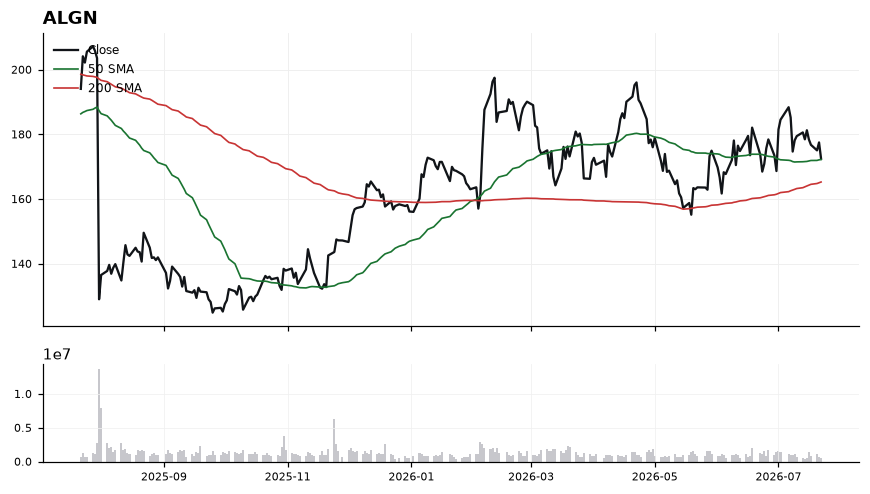
EntryTiered long: starter on a reclaim/hold above 173.00–174.00 (50-SMA back as support with MACD histogram narrowing); add on strength through 176.50 which would confirm momentum turn.
InvalidationClosing break below 165.27 (200-SMA); losing this level negates the long-term uptrend structure and shifts bias to distribution rather than base.
Targets180.00 — first supply shelf and prior consolidation resistance → 188.00 — measured extension if MACD crosses back above signal
TimeframeSwing (2-6 weeks)
Inflection66
Probability69
Quality86
HIMS is coiling just above both key moving averages (50-SMA 30.17, 200-SMA 31.29) with price at 31.68, sitting only 1.26% above the long-term trend line — a classic inflection zone where the Long bias either confirms or fails.
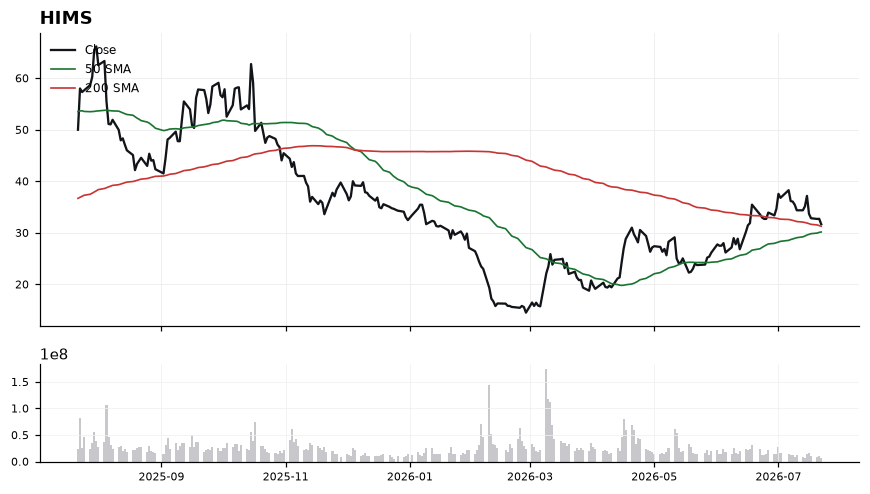
Price has reclaimed the 200-SMA but momentum is not yet in gear: RSI(14) at 45.22 is sub-50 and MACD at 0.60 remains below its signal at 1.34, signaling recent deceleration. The 50-SMA at 30.17 has crossed under the 200-SMA territory, so the 30.17–31.29 band now acts as a stacked support shelf that must hold. A trade-quality score of 85.8 alongside a 66 inflection reading suggests structure is favorable, but momentum needs to turn before trend follow-through.
EntryPreferred accumulation on a pullback into the 30.20–31.30 support shelf (50-SMA/200-SMA confluence); alternatively, a momentum trigger on a reclaim above 32.50 with MACD crossing back above its signal line.
InvalidationDaily close below 29.60 invalidates the setup — it would break the 50-SMA support and confirm loss of the 200-SMA, flipping structure back to lower-highs.
TargetsFirst target 34.00 (recent supply / prior swing area) → Second target 36.50 (extension objective on trend re-engagement)
TimeframeSwing (2-6 weeks)
Inflection48
Probability83
Quality91
AMZN sits at 244.85, wedged between the rising 200-SMA at 234.46 (+4.43% below) and the 50-SMA cap at 250.60, coiling for a directional resolution. With MACD flipping positive (0.56 vs -0.16) while RSI at 48.4 remains neutral, the tape is inflecting from consolidation toward a potential trend re-engagement — consistent with the Long bias and the 83.0 profit-probability score.
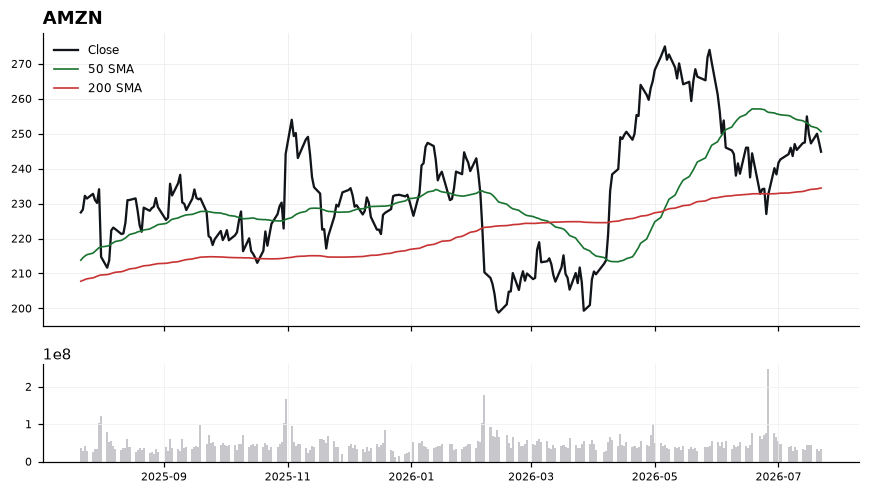
Price is 2.3% below the 50-SMA and 4.4% above the 200-SMA, defining a tight mean-reversion band that must resolve. The MACD crossover above signal (0.56 vs -0.16) confirms nascent upside momentum, but RSI at 48.4 shows buyers have not yet taken control, keeping the technical-inflection score modest at 47.6. A reclaim of the 50-SMA at 250.60 would flip trend structure fully bullish; failure there keeps 234.46 (200-SMA) as the key demand shelf. Trade-quality of 90.7 reflects a favorable risk-defined structure at this juncture.
EntryStagger entries: initial tranche on strength through 246.50 confirming the MACD signal, with an add on a decisive break and hold above the 50-SMA at 250.60. Alternative: accumulate on a controlled pullback into 238.00–240.00 that holds above the 200-SMA.
InvalidationClosing break below 233.50 (just under the 200-SMA at 234.46) invalidates the long thesis — it would negate the higher-low structure and signal loss of the multi-month trend support.
Targets258.00 — reclaim and extension above the 50-SMA at 250.60 → 266.00 — measured move projecting the range width off the 200-SMA base
TimeframeSwing (2-6 weeks)
Inflection31
Probability98
Quality87
NVDA is grinding higher within its MAG7 uptrend, sitting just above the 50-SMA (209.68) and 10.05% clear of the 200-SMA (192.69), setting up an inflection where price must defend rising short-term support to keep the trend structure intact.
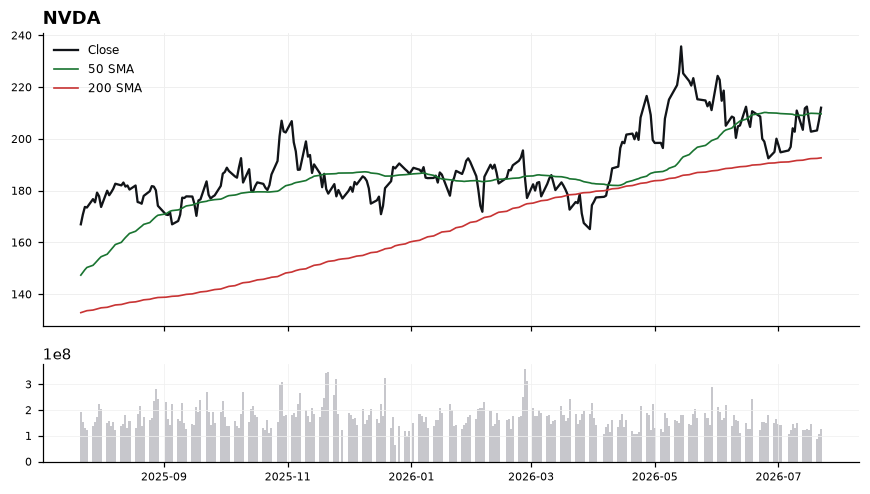
Price at 212.06 holds above both the 50-SMA (209.68) and 200-SMA (192.69), confirming a stacked bullish moving-average alignment. RSI(14) at 56.18 is constructive but not overbought, leaving room to extend before momentum exhaustion. MACD at 0.73 versus a signal of -0.36 has crossed positive, reinforcing an early-stage momentum turn. However, a technical-inflection score of 31.3 tempers urgency — the setup is a trend continuation, not a fresh breakout.
EntryPreferred accumulation zone 209.70–212.00, near 50-SMA reclaim; a confirming break and hold above 213.00 would strengthen the momentum trigger.
InvalidationInvalidation on a close below 205.00 — this would break the 50-SMA (209.68) support cleanly and signal the MACD cross is failing, opening a path back toward the 200-SMA.
TargetsFirst target 220.00 — extension of the current momentum leg above the 50-SMA shelf. → Second target 228.00 — measured continuation as distance to the 200-SMA expands beyond 15%.
TimeframeSwing (2-6 weeks)
Inflection55
Probability69
Quality88
QCOM is trading at 175.63, holding just 3.84% above its rising 200-SMA (169.14) while sitting well below the 50-SMA at 205.23 — a classic long-bias inflection where trend support meets a corrective downswing.
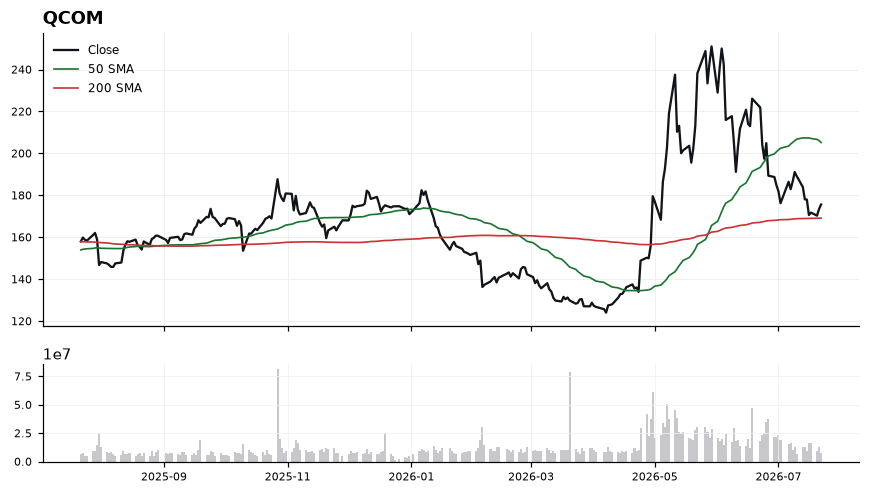
Price above the 200-SMA but far under the 50-SMA signals a pullback within an intact longer-term uptrend, with the 50/200 gap defining the mean-reversion opportunity. RSI at 41.57 is soft but not oversold, leaving room for further chop before a decisive turn. MACD at -8.35 versus signal -7.72 remains negative and slightly widening, so downside momentum has not yet reversed. Trade-quality of 88.1 and profit-probability of 69.0 argue the risk/reward is favorable if the 200-SMA shelf holds.
EntryStage entries on either a reclaim of 180 with MACD narrowing toward signal, or a controlled pullback into the 170-172 zone near the 200-SMA
InvalidationDaily close below 166; losing the 200-SMA would invalidate the long-term uptrend thesis and open a deeper de-rating
TargetsFirst target 190 (gap-fill toward mid-range between the SMAs) → Second target 205 near the 50-SMA where trend resistance re-engages
TimeframeSwing (2-6 weeks)
Ranked by technical inflection, profit-probability, and trade quality. Educational only. Not financial advice.