Price at 242.67 has reclaimed footing above the 200-SMA (232.98) but remains capped by the 50-SMA at 255.42, defining a clear compression range. The MACD histogram turning positive while still below zero signals early trend repair rather than confirmed reversal. RSI near the 50 midline shows balanced flow, leaving room to expand upward without overbought risk. The 4.16% cushion to the 200-SMA provides a defined risk framework for a long tilt.
Sunday Playbook — Top 5 Setups
The day's five highest-conviction setups, ranked by technical inflection, profit-probability, and trade quality — 4 long, 1 short. Trade your plan and manage risk first. Also screened: $TSLA, $ANET, $GOOGL, $META, $TSM, $ASML.
Inflection53
Probability83
Quality91
AMZN is coiling between its rising 200-SMA (232.98) and a declining 50-SMA (255.42), sitting 4.16% above long-term trend support. With RSI at 48.70 and MACD (-4.39) crossing above its signal (-5.30), momentum is inflecting higher from a neutral base within the MAG7 long bias.
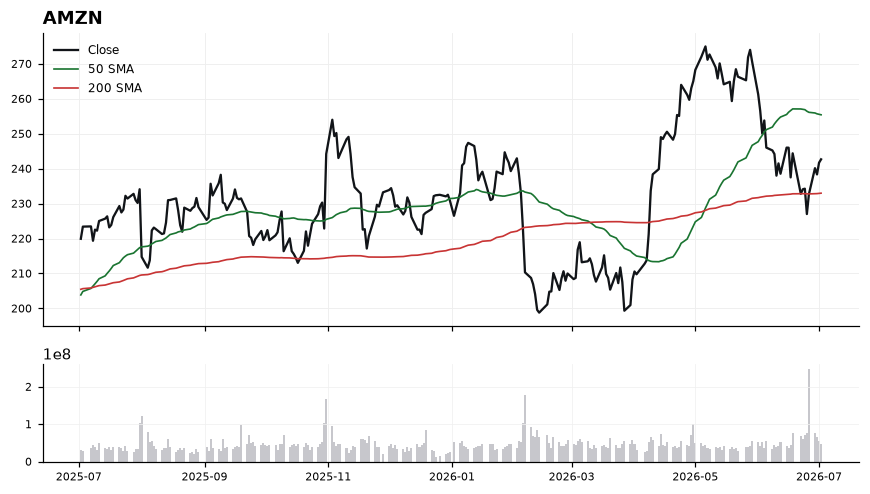
EntryAccumulate 240-243 on stabilization, or add on a momentum trigger through 248 that opens the path to test the 50-SMA at 255.42
InvalidationDaily close below 232.50 (just under the 200-SMA); breaking it invalidates the long-term uptrend structure and negates the MACD inflection thesis
TargetsFirst target: 255.42 (50-SMA convergence) → Second target: 265.00 (extension above reclaimed 50-SMA)
TimeframeSwing (2-6 weeks)
Inflection61
Probability69
Quality92
NVDA is testing its 200-SMA (191.03) from above while trading below its 50-SMA (209.80), a classic pullback-to-support setup within the broader MAG7 uptrend. With price just 1.99% above the 200-day and RSI at 41.16, the tape is at a decision point: hold and rebuild, or lose the long-term trend line.
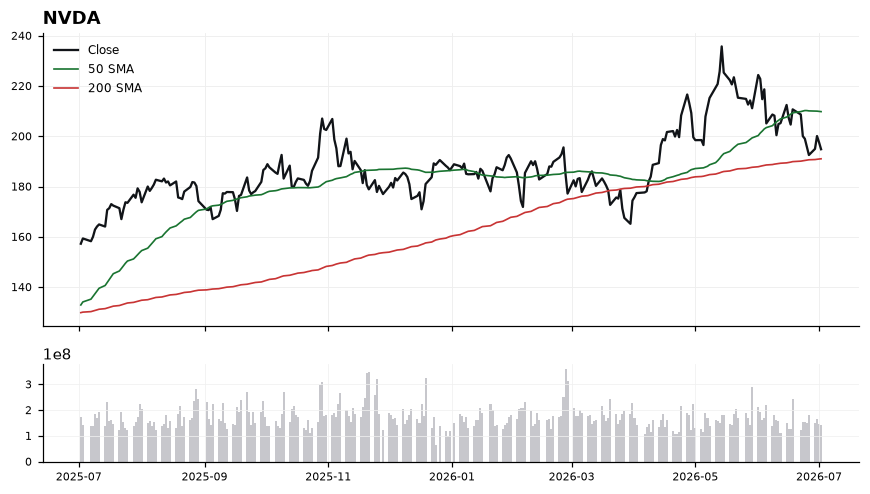
Price 194.83 sits in the narrow zone between reclaimed long-term support (200-SMA at 191.03) and rejected mean (50-SMA at 209.80), defining a ~15-point compression range. RSI(14) at 41.16 reflects washed-out but not oversold conditions, leaving room for a mean-reversion push higher without divergence risk. MACD at -4.09 versus signal -3.09 remains negative and still widening, signaling that downside momentum has not yet fully rolled over — a bullish trigger requires MACD to curl back toward its signal line. Net read: constructive base-building near the 200-SMA, but confirmation is still pending.
EntryStaged accumulation 192.00–195.00 near the 200-SMA, with a momentum add-on trigger above 200.00 on MACD crossover confirmation.
InvalidationDaily close below 188.00 (roughly 1.5% under the 200-SMA); a break there invalidates the long-term trend support and opens a structural downshift.
TargetsFirst target 209.80 at the 50-SMA — the primary mean-reversion objective → Second target 218.00–220.00 on a 50-SMA reclaim and MACD bullish cross
TimeframeSwing (2-6 weeks)
Inflection69
Probability56
Quality90
AVGO is pinned at its 200-day SMA (361.45) after slipping 12% below its 50-day (409.43), turning this level into a decisive inflection between trend continuation lower and a mean-reversion bounce.
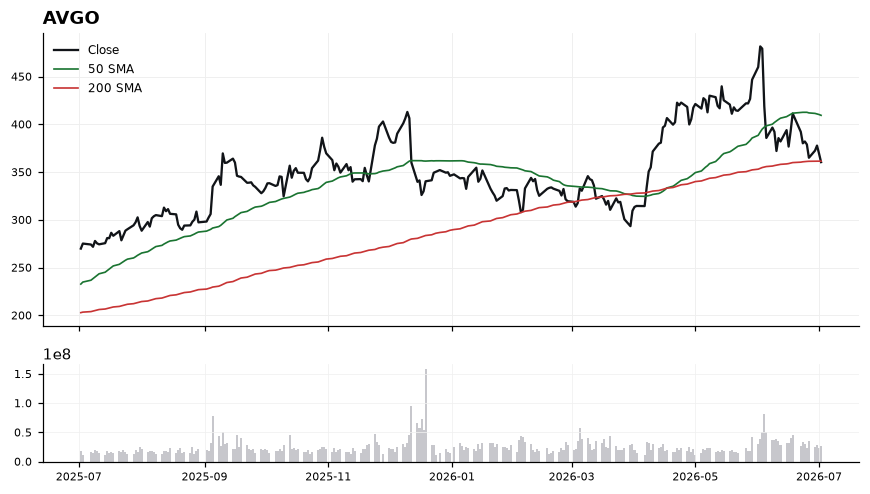
Price at 360.45 sits -0.28% under the 200-SMA, a battleground zone that has flipped from support to immediate resistance. RSI at 39.63 is weak but not yet oversold, leaving room for further downside before exhaustion. MACD at -11.74 remains below its signal line (-9.28) and the gap is widening, confirming downside momentum is still in control. The 50-SMA at 409.43 sits far overhead, defining a clear bearish stack that favors selling into strength rather than chasing weakness.
EntryShort entry zone 362-368 on failed retests of the 200-SMA (361.45); aggressive trigger on a decisive close back below 358 that reasserts breakdown.
InvalidationInvalidation on a sustained close above 375. Breaking that level would neutralize the MACD downtrend, reclaim the 200-SMA with conviction, and open a path back toward the 50-SMA.
TargetsFirst target 345 (prior demand shelf below the 200-SMA) → Second target 330 (measured extension as RSI approaches oversold)
TimeframeSwing (2-6 weeks)
Inflection54
Probability64
Quality88
QCOM sits at a working-bias long inflection: price 176.25 hovers just 4.68% above the rising 200-SMA (168.36), while trading well below the 50-SMA (202.48), setting up a classic mean-reversion test against the long-term trendline.
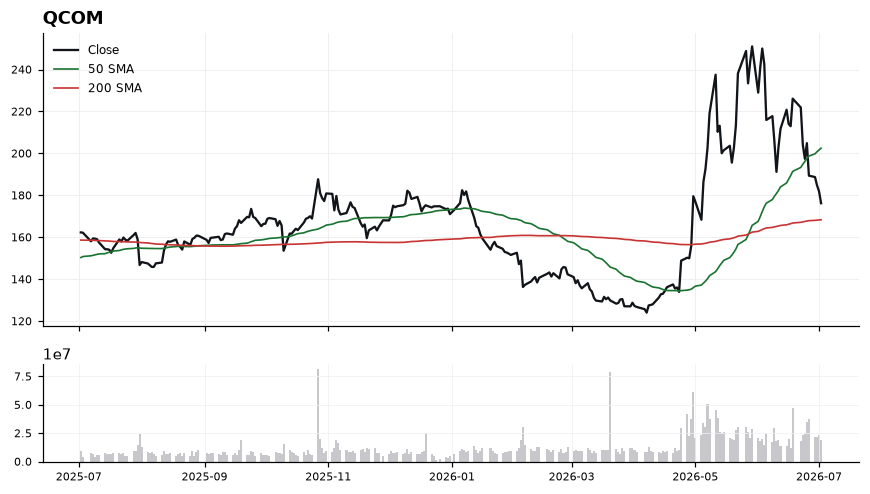
The tape shows near-term weakness confirmed by MACD at -6.81 versus signal -1.65, indicating momentum has yet to turn, but RSI at 38.13 is approaching oversold and suggests downside is maturing. The 50-SMA at 202.48 sits ~15% overhead, defining the ceiling of the corrective range, while the 200-SMA at 168.36 anchors structural support just below spot. The narrow 4.68% cushion to the 200-day makes this a decision zone: hold and momentum can reset higher, lose it and the longer trend comes into question.
EntryStagger entries: initial tranche 174.00–176.50 (current zone), add on either a reclaim of 180.00 with MACD histogram narrowing, or a controlled retest of 168.50–170.00 near the 200-SMA.
InvalidationDaily close below 165.00 (roughly 2% under the 200-SMA); a break there invalidates the mean-reversion thesis and signals a regime shift from correction to trend break.
TargetsFirst target 190.00 — prior consolidation shelf and midpoint back toward the 50-SMA → Second target 202.00 — convergence with the 50-SMA at 202.48, where trend resistance is likely to be retested
TimeframeSwing (3-6 weeks)
Inflection25
Probability98
Quality84
AAPL trades at 308.63, riding a bullish stack above the 50-SMA (293.52) and 200-SMA (270.69) with RSI at 60.26 — firm but not yet overbought. The inflection: MACD (-0.69) is curling above its signal (-0.95), hinting at momentum re-acceleration while price extends 14.02% above the 200-day.
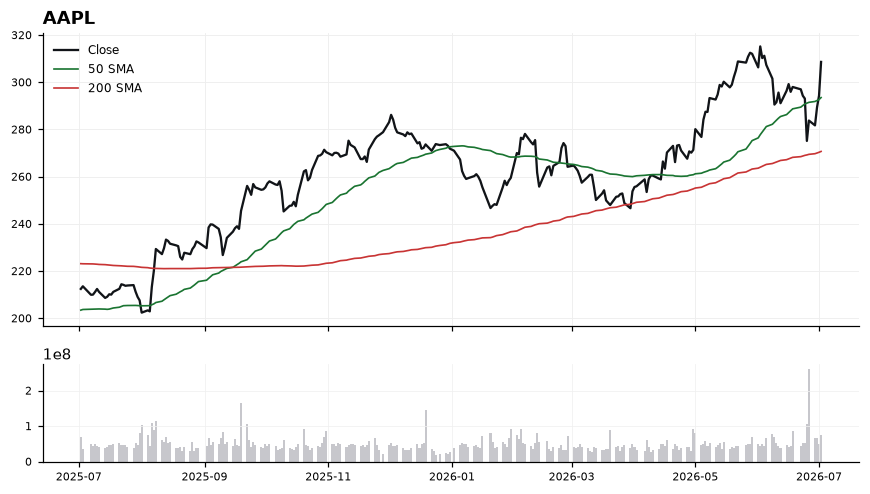
Trend structure is constructive: price > 50-SMA > 200-SMA confirms an intact uptrend, and the 50-SMA at 293.52 acts as first dynamic support. RSI at 60.26 shows healthy momentum with room before the 70 threshold, while the MACD histogram narrowing toward a bullish cross argues the recent pullback is stabilizing. However, the 14.02% premium to the 200-SMA and a modest technical-inflection score (25.3) suggest extension risk — trade-quality (84.3) rewards patience over chase. Reclaim and hold above 308-310 is the tell for continuation.
EntryPrefer staggered entries: initial tranche on a pullback into 298-302 (just above the 50-SMA at 293.52), add on a momentum trigger — daily close back above 310 with MACD confirming its cross above signal.
InvalidationDaily close below 292 (loss of the 50-SMA at 293.52). Breaking this level would flip the near-term structure, expose the mid-270s gap toward the 200-SMA, and invalidate the long working bias.
TargetsFirst target 318-322: recent supply zone and measured extension from the 50-SMA base → Second target 332-335: trend-continuation objective if MACD cross holds and RSI pushes toward 70
TimeframeSwing (2-6 weeks)
Ranked by technical inflection, profit-probability, and trade quality. Educational only. Not financial advice.