Price at 242.67 trades below the 50-SMA (255.42) but comfortably above the 200-SMA (232.98), keeping the primary uptrend structurally intact. RSI at 48.70 is neutral with room to expand, while MACD at -4.39 crossing above its signal at -5.30 marks an early momentum turn from oversold conditions. The 50-SMA acts as the immediate ceiling; reclaiming it would flip the intermediate tape bullish, whereas failure keeps price range-bound between 233 and 255.
Saturday Playbook — Top 5 Setups
The day's five highest-conviction setups, ranked by technical inflection, profit-probability, and trade quality — 4 long, 1 short. Trade your plan and manage risk first. Also screened: $TSLA, $ANET, $GOOGL, $META, $TSM, $ASML.
Inflection53
Probability83
Quality91
AMZN is coiling between its rising 200-SMA (232.98) and declining 50-SMA (255.42), sitting 4.16% above long-term trend support — a classic inflection where the Long bias needs confirmation from momentum before committing size.
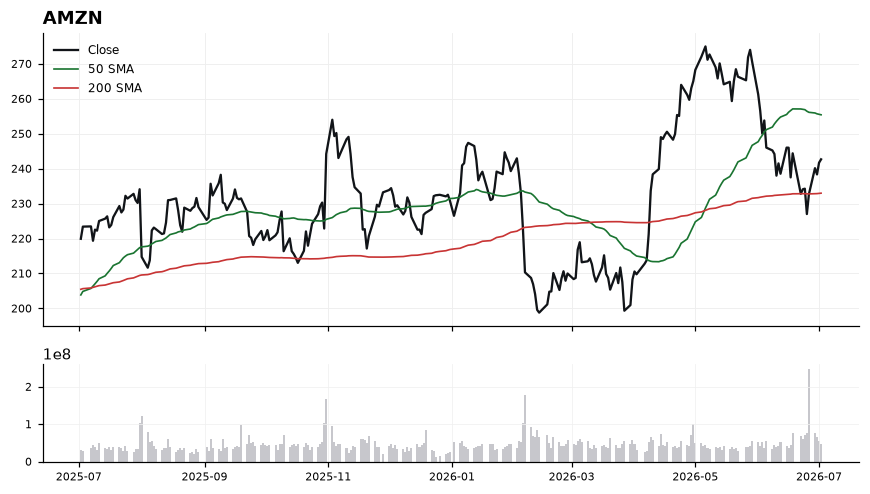
EntryStaged accumulation 240–243 on constructive holds of the 200-SMA; add-on trigger on a reclaim of the 50-SMA at 255.42 with MACD crossing positive.
InvalidationDaily close below 232.00 (under the 200-SMA); breaking it invalidates the long-term uptrend and negates the MACD turn.
Targets255.40 — 50-SMA reversion and first supply zone → 268.00 — measured move above 50-SMA reclaim
TimeframeSwing (2-6 weeks)
Inflection61
Probability69
Quality92
NVDA is coiling just above its 200-SMA (191.03) while trading below its 50-SMA (209.80), setting up a classic mean-reversion inflection where the long-term trend line is being retested as support. With a trade-quality score of 92.3 and profit-probability of 69.0, the risk/reward is skewed favorably if the 200-day holds.
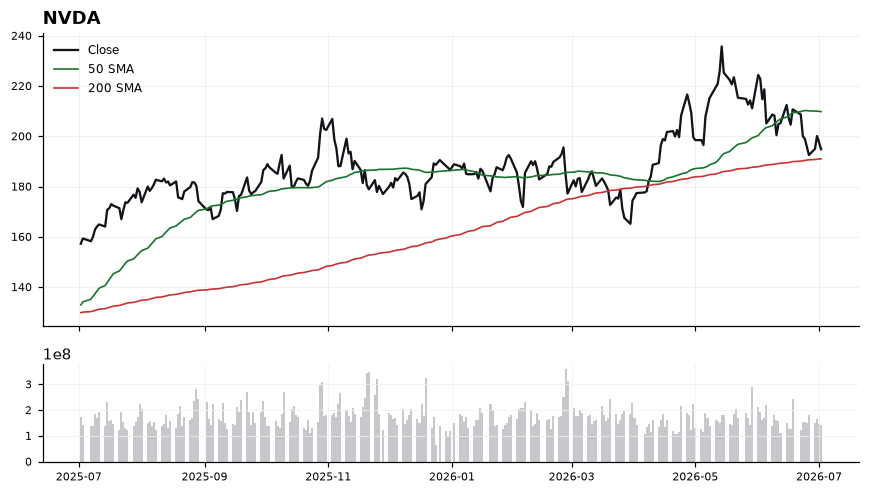
Price at 194.83 sits only 1.99% above the 200-SMA, making that level the decisive line separating trend-intact from trend-break scenarios. RSI at 41.16 reflects washed-out but not oversold momentum, leaving room for upside without stretched conditions. MACD at -4.09 versus signal -3.09 confirms momentum is still negative and has not yet crossed, so confirmation of a turn has not printed. The gap between price and the 50-SMA (~7.7%) defines the mean-reversion runway overhead.
EntryStaged entries: initial tranche 193.00–195.00 near current price with the 200-SMA as backstop; add on MACD bullish crossover or reclaim of 200.00 as trigger confirmation.
InvalidationDaily close below 188.50 (roughly 1.3% under the 200-SMA) invalidates the long thesis — it would mark loss of the long-term trend support and open downside continuation.
Targets209.80 at the 50-SMA (approx. +7.7% from entry) as first mean-reversion objective → 218.00–220.00 on a 50-SMA reclaim, targeting the prior consolidation shelf
TimeframeSwing (2-6 weeks)
Inflection69
Probability56
Quality90
AVGO is pinned right at its 200-SMA (361.45) after sliding well below its 50-SMA (409.43), creating a decisive inflection where a breakdown through the long-term trend line would confirm the working short bias.
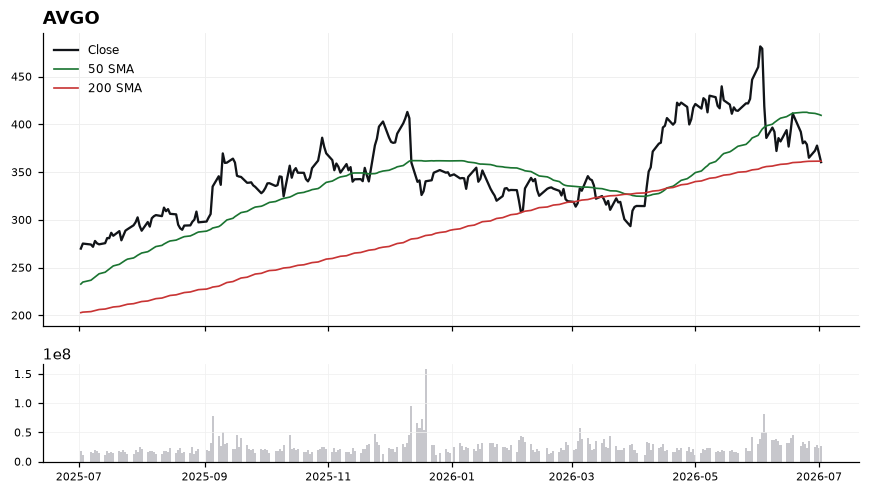
Price at 360.45 sits -0.28% under the 200-SMA, with the 50-SMA nearly 49 points overhead acting as a distant ceiling and confirming a downward-sloping short-term structure. RSI at 39.63 is weak but not yet oversold, leaving room for further downside before exhaustion. MACD at -11.74 remains below its signal at -9.28, indicating momentum is still expanding to the downside rather than curling up. The tape is coiled on the 200-SMA — a reclaim would neutralize the short thesis, while rejection opens the trap door.
EntryShort trigger on a decisive break and 1H close below 359.00, or on a failed retest into 364-368 that rejects back under the 200-SMA
InvalidationInvalidation on a sustained reclaim above 372.00; breaking that level signals the 200-SMA is holding as support and momentum is mean-reverting toward the 50-SMA
Targets345.00 — first measured move once the 200-SMA fails → 330.00 — extension target if MACD momentum continues to expand
TimeframeSwing (2-6 weeks)
Inflection54
Probability64
Quality88
QCOM sits at a technical inflection: price 176.25 is holding just 4.68% above the rising 200-SMA (168.36) while trading well below the 50-SMA (202.48), framing a classic pullback-to-support setup within a semiconductor uptrend regime. The working long bias hinges on this 200-day zone acting as a demand shelf before momentum resets.
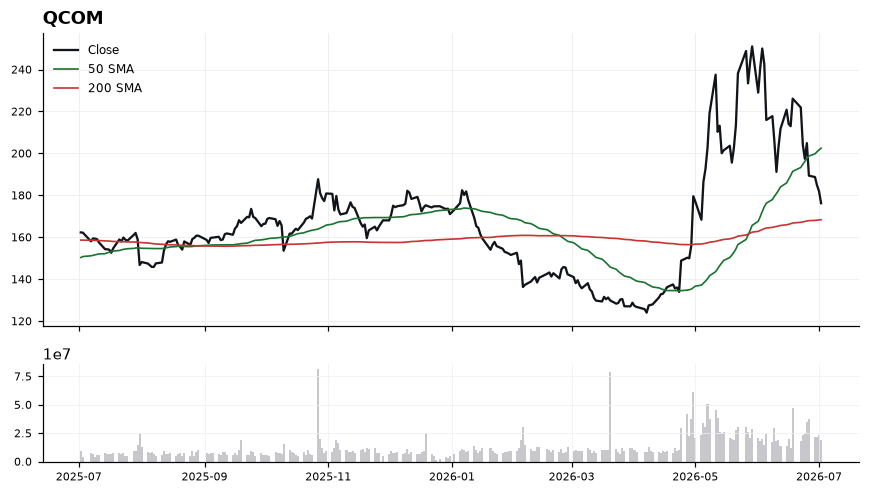
RSI(14) at 38.13 is approaching oversold without confirming it, suggesting sellers are tiring but no reversal signal yet. MACD at -6.81 versus signal -1.65 shows momentum still expanding to the downside, so trend confirmation is lacking despite the constructive longer-term structure (price > 200-SMA). The 26+ point gap between price and the 50-SMA highlights how stretched the pullback is, while the shallow 4.68% cushion to the 200-SMA leaves little room for error. Trade-quality scores 87.5 and profit-probability 64.0, but technical-inflection at 54.2 argues for staged entries rather than a full commit.
EntryScale-in zone 170.00-173.00 on stabilization near the 200-SMA (168.36); confirmation trigger on a reclaim of 178.50 with RSI turning up through 45 and MACD histogram narrowing.
InvalidationDaily close below 165.00 (roughly 2% under the 200-SMA) invalidates the long thesis, signaling the primary trend support has failed and opening a deeper mean-reversion leg.
Targets189.00 — prior consolidation shelf and midpoint back toward the 50-SMA → 202.00 — reversion to the 50-SMA (202.48) where trend re-alignment would be tested
TimeframeSwing (3-6 weeks)
Inflection25
Probability98
Quality84
AAPL trades at 308.63, sitting 5.1% above its rising 50-SMA (293.52) and 14.0% above the 200-SMA (270.69), with a MAG7 leadership tape and MACD (-0.69 vs signal -0.95) curling higher from below zero — an early momentum inflection within an established uptrend.
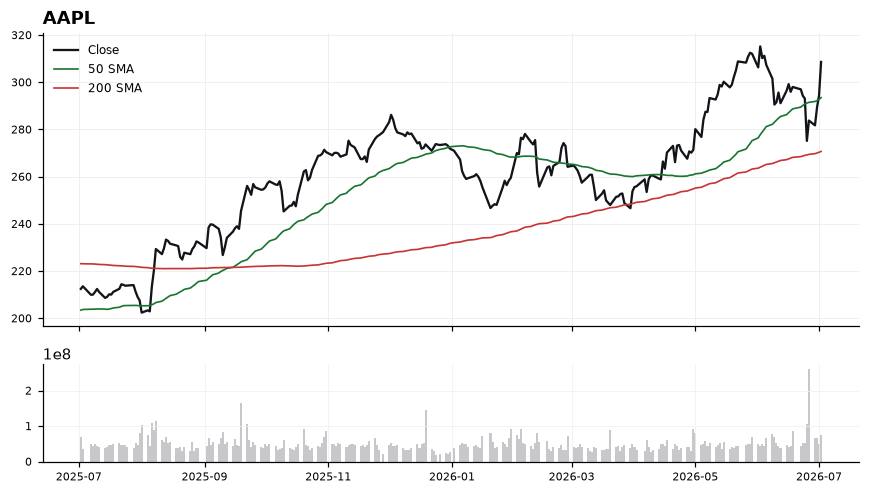
RSI at 60.26 confirms constructive momentum without stretching into overbought territory, leaving room to extend. The MACD histogram turning positive beneath the zero line signals a nascent bullish crossover after a pullback, while price holding well above both the 50 and 200-SMA validates trend integrity. The 14% distance to the 200-SMA does flag some extension risk, so pullbacks toward the 50-SMA (293.52) are the higher-quality entry windows rather than chasing strength here.
EntryPreferred accumulation zone 298–302 on pullback, with a secondary tactical trigger on a reclaim/close above 310.50 confirming continuation from current price 308.63.
InvalidationDaily close below 293.00 (the 50-SMA at 293.52 rounded); breaking this level would break the near-term uptrend structure and shift bias to neutral pending a retest of the 200-SMA.
TargetsFirst target 318.00 — measured continuation from the current base → Second target 328.50 — extension objective on trend continuation
TimeframeSwing (2-6 weeks)
Ranked by technical inflection, profit-probability, and trade quality. Educational only. Not financial advice.