Price trades below the 50-SMA (255.42) but constructively above the 200-SMA (232.98), preserving the primary uptrend structure. The MACD histogram has flipped positive as the line (-4.39) crossed above signal (-5.30), a first sign that the pullback from the 50-SMA is losing downside energy. RSI at 48.70 is mid-range with room to expand upward before hitting overbought, and the 4.16% cushion to the 200-SMA gives a defined risk perimeter. Trade-quality (90.9) and profit-probability (83.0) scores are strong, but technical-inflection at 53.4 argues for confirmation over anticipation.
Friday Playbook — Top 5 Setups
The day's five highest-conviction setups, ranked by technical inflection, profit-probability, and trade quality — 4 long, 1 short. Trade your plan and manage risk first. Also screened: $TSLA, $ANET, $GOOGL, $META, $TSM, $ASML.
Inflection53
Probability83
Quality91
AMZN is coiling between its rising 200-SMA (232.98) and a declining 50-SMA (255.42), with price at 242.67 sitting just 4.16% above long-term trend support. This is a classic inflection: momentum is turning up (MACD -4.39 crossing above signal -5.30) while RSI at 48.70 remains neutral, leaving directional resolution pending.
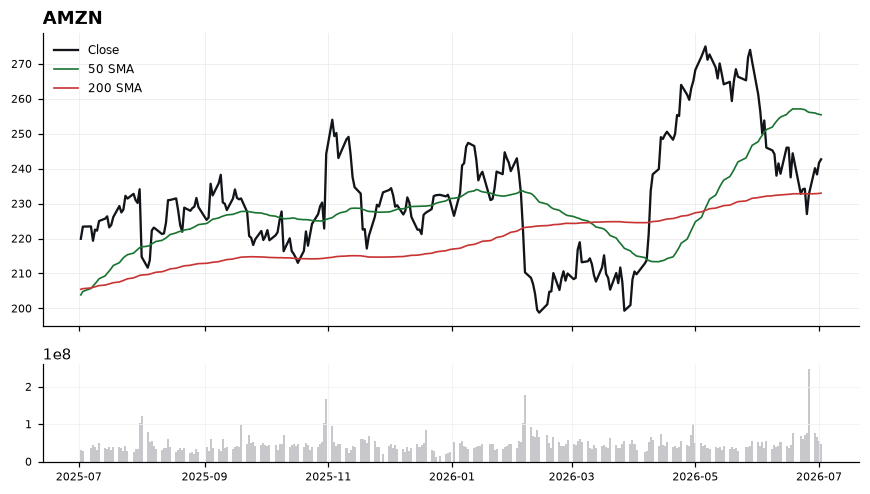
EntryStage entries on strength: initial tranche on a reclaim of 248-250 with MACD holding its positive cross; add on a decisive close back above the 50-SMA at 255.42.
InvalidationDaily close below 232.98 (200-SMA). A break there negates the long-term uptrend structure and invalidates the dip-buy thesis, opening downside continuation risk.
Targets255.42 — the 50-SMA, first supply/mean-reversion objective → 268-272 — measured extension above the 50-SMA reclaim
TimeframeSwing (2-6 weeks)
Inflection61
Probability69
Quality92
NVDA is coiling just 1.99% above its rising 200-SMA (191.03) while trading below a declining 50-SMA (209.80), setting up a classic mean-reversion inflection where the long-term trend line must hold to preserve the working long bias.
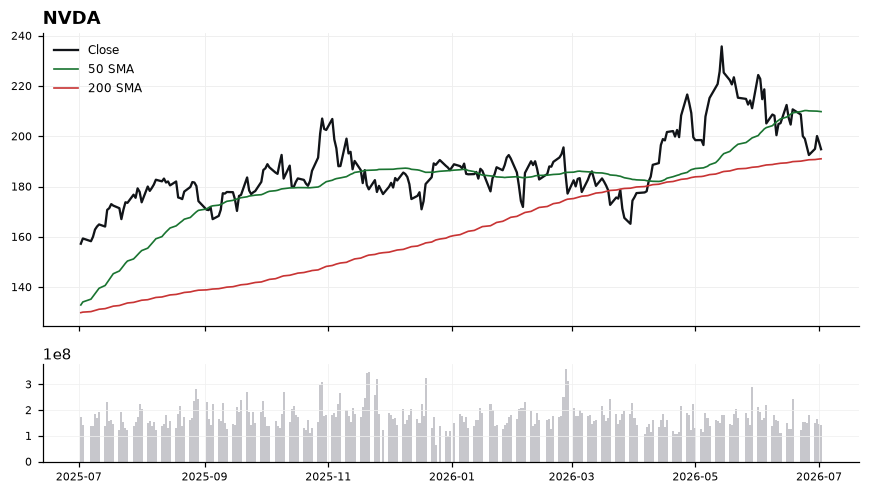
Price at 194.83 is sandwiched between critical moving averages, with the 200-SMA at 191.03 acting as the last line of defense and the 50-SMA at 209.80 as overhead resistance. RSI at 41.16 signals weakening momentum but is not yet oversold, leaving room for further downside probes before exhaustion. MACD at -4.09 sits below its signal at -3.09, confirming the near-term momentum deficit, though a trade-quality score of 92.3 and profit-probability of 69.0 suggest the risk/reward is skewed favorably at these levels.
EntryStage entries on a controlled test of the 191.03-193.00 zone (200-SMA reclaim) or on a momentum trigger above 197.50 that signals MACD curl toward its signal line.
InvalidationDaily close below 188.50 (roughly 1.3% under the 200-SMA) invalidates the setup, as it would break the long-term trend structure and shift bias to neutral/short.
TargetsFirst target 209.80 at the declining 50-SMA, where trapped supply is likely to cap the first leg → Second target 218.00, a measured extension above the 50-SMA if momentum flips positive
TimeframeSwing (2-6 weeks)
Inflection69
Probability56
Quality90
AVGO is pinned right at its 200-SMA (361.45) after rolling over from the 50-SMA at 409.43, making this a classic make-or-break inflection where a decisive break either confirms the short thesis or triggers a reflex bounce.
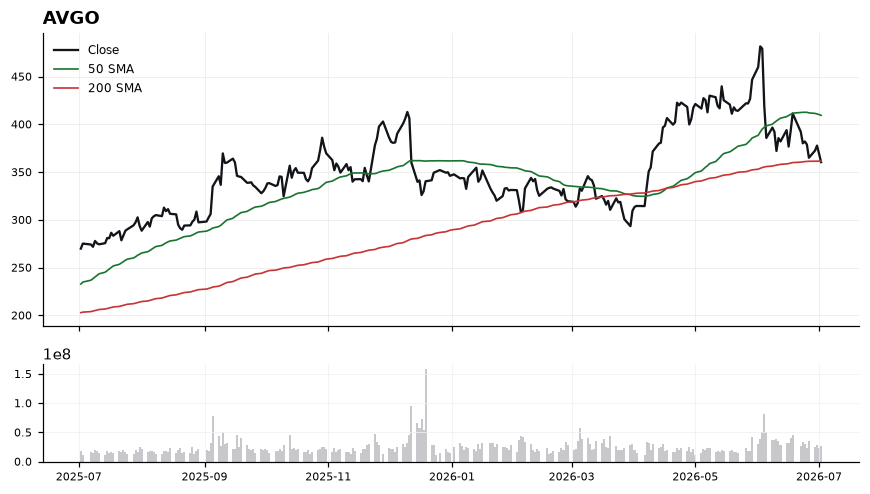
Price at 360.45 sits -0.28% below the 200-SMA, with the 50-SMA (409.43) capping ~13.6% overhead and defining the downtrend. RSI(14) at 39.63 is weak but not oversold, leaving room for further downside before exhaustion. MACD at -11.74 remains below its signal (-9.28), confirming momentum is still deteriorating rather than turning. The tape is compressed on the 200-SMA — a level that has acted as long-term structural support and now serves as the pivot for directional resolution.
EntryShort trigger on a daily close below 358.50 (clean break of the 200-SMA at 361.45); alternatively, fade rallies into the 372-378 zone if price bounces first.
InvalidationInvalidation on a daily close above 385.00 — this would signal the 200-SMA has held as support and put price back on trajectory toward the 50-SMA, negating the bearish momentum read.
TargetsFirst target 345.00 (measured move below the 200-SMA breakdown) → Second target 330.00 (extension of the downtrend from the 50-SMA rejection)
TimeframeSwing (2-6 weeks)
Inflection54
Probability64
Quality88
QCOM is a Long-bias name caught in a corrective pullback, trading at 176.25 — well below the 50-SMA at 202.48 but still holding a 4.68% cushion above the 200-SMA at 168.36. The setup sits at an inflection because momentum is stretched to the downside (MACD -6.81 vs signal -1.65, RSI 38) while price is testing the rising long-term trend line.
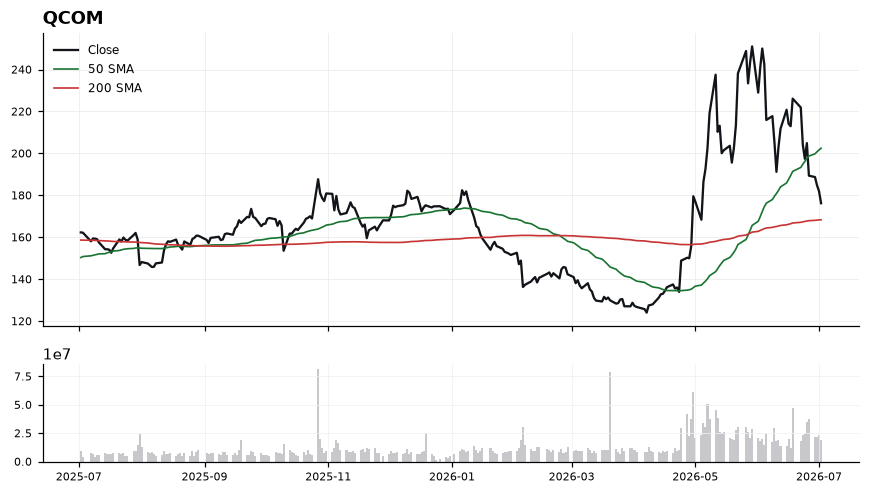
The tape shows a clear short-term downtrend inside a longer-term uptrend: price is roughly 13% under the 50-SMA yet above the 200-SMA, signaling a mean-reversion opportunity rather than a broken structure. RSI at 38.13 is approaching oversold without confirming it, leaving room for one more flush toward the 168.36 200-SMA. MACD at -6.81 versus its -1.65 signal line reflects deep negative momentum, but the widening spread often precedes exhaustion. Trade-quality score of 87.5 and profit-probability of 64 argue the risk/reward is favorable if the 200-SMA holds.
EntryStagger entries between 172.00 and 168.50, ideally on a reclaim of 173 after a tag of the 200-SMA at 168.36; avoid chasing above 180 without MACD turning up.
InvalidationDaily close below 165.00 invalidates the thesis — that breaks the 200-SMA support and shifts the long-term trend from uptrend to distribution.
Targets185.00 — reversion toward the mid-range gap between the 200- and 50-SMAs → 200.00 — retest of the 50-SMA at 202.48, where sellers likely re-engage
TimeframeSwing (2-6 weeks)
Inflection25
Probability98
Quality84
AAPL trades at 308.63, extended 14.02% above its 200-SMA (270.69) and 5.1% above its 50-SMA (293.52), with RSI at 60.26 and MACD (-0.69) curling above its signal (-0.95) — a momentum inflection where trend structure remains intact but stretch invites a pullback-to-continuation setup.
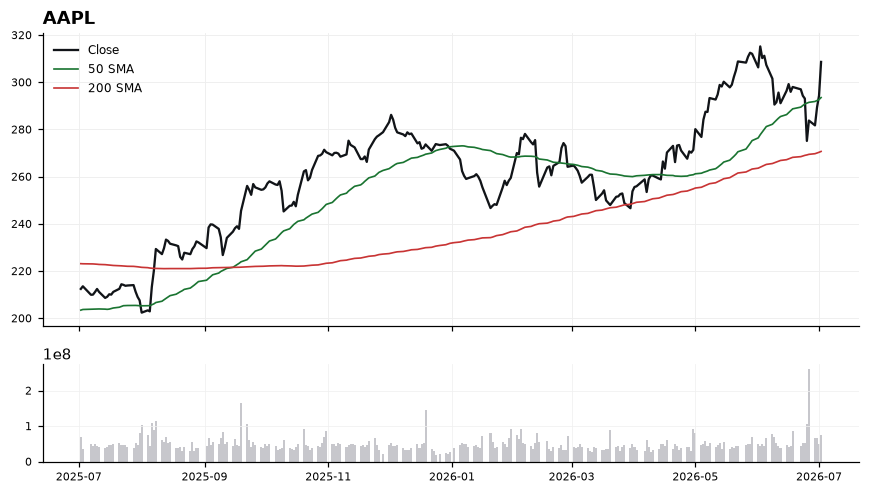
Price sits firmly in an uptrend regime: 50-SMA > 200-SMA and spot > both, confirming trend alignment. RSI at 60.26 shows constructive momentum without overbought excess, and the MACD histogram narrowing (-0.69 vs -0.95) signals a fading downside impulse and potential positive cross. However, technical-inflection scores just 25.3, indicating the edge is trend-continuation on a dip rather than a fresh breakout, given the 14%+ premium to the 200-SMA.
EntryPreferred pullback entry into the 293.50–298.00 zone (retest of 50-SMA); alternative momentum-confirmation entry on a close back above 310.00 with MACD crossing positive.
InvalidationDaily close below 288.00 (below 50-SMA structure); breaking it signals loss of trend support and opens a mean-reversion path toward the 200-SMA near 270.69.
Targets315.00 — reclaim of recent highs and continuation objective → 328.00 — measured extension consistent with trend continuation from the 50-SMA base
TimeframeSwing (2-6 weeks)
Ranked by technical inflection, profit-probability, and trade quality. Educational only. Not financial advice.