Trend structure is constructive: the 50-SMA at 600.20 sits below the 200-SMA at 642.22, but price leadership above both averages signals a developing golden-cross setup. Momentum confirms — RSI(14) at 62.78 is firm but not yet overbought, while MACD at 11.93 is decisively above its signal at 0.23, a wide positive spread indicating fresh trend acceleration. The proximity to the reclaimed 200-SMA (642.22) provides a well-defined risk anchor, and the trade-quality score of 92.1 reflects the alignment of trend, momentum, and inflection.
Monday Playbook — Top 5 Setups
The day's five highest-conviction setups, ranked by technical inflection, profit-probability, and trade quality — 4 long, 1 short. Trade your plan and manage risk first. Also screened: $SPY, $NVDA, $IBM, $RH, $CAVA, $HPQ.
Inflection63
Probability83
Quality92
META trades at 656.73, holding above both the 50-SMA (600.20) and 200-SMA (642.22) after reclaiming the long-term trend line — a classic bullish inflection now sitting just 2.26% above the 200-day.
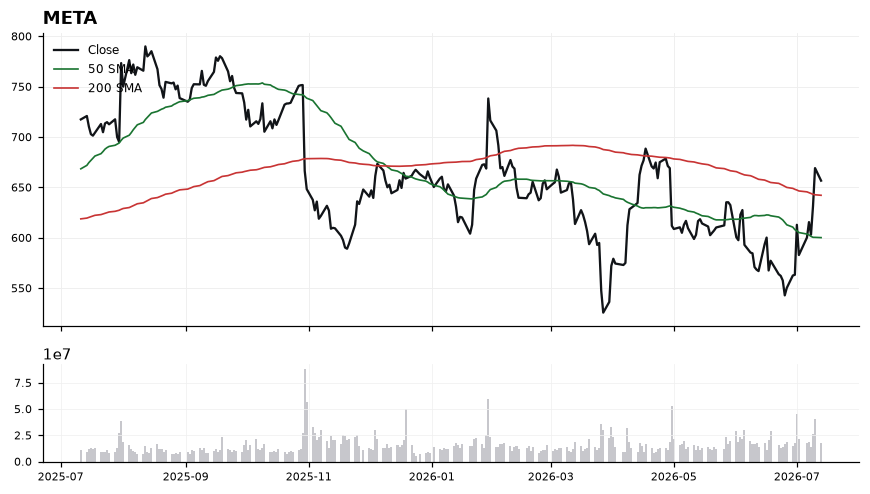
EntryPreferred accumulation on a pullback into 642–648 (retest of the 200-SMA at 642.22); breakout add-on above 660 on momentum continuation.
InvalidationDaily close below 638 invalidates the 200-SMA reclaim and flips the near-term structure; a deeper failure toward the 50-SMA at 600.20 would negate the long bias entirely.
TargetsFirst target 685 (measured extension from the 200-SMA reclaim, ~4.3% upside) → Second target 705–712 (trend continuation objective as MACD spread persists)
TimeframeSwing (2-6 weeks)
Inflection48
Probability83
Quality90
AMZN is coiled between a rising 200-SMA support at 233.47 and 50-SMA resistance at 253.72, with price at 247.31 sitting 5.93% above its long-term trend line. The setup is at an inflection as MACD (-1.05 vs signal -2.83) has turned higher from negative territory while RSI at 52.91 reclaims the neutral line — a classic pre-breakout compression.
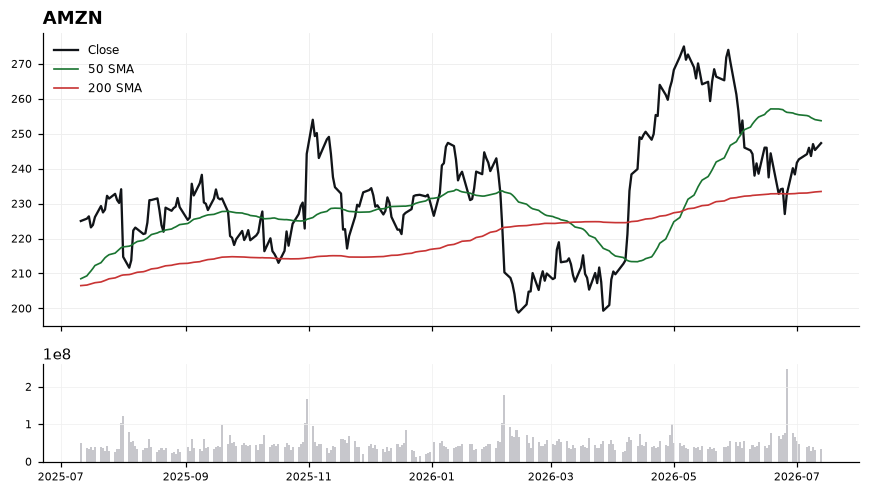
Price trades below the 50-SMA (253.72) but well above the 200-SMA (233.47), keeping the primary uptrend intact. The MACD histogram is expanding positively with signal-line crossover confirmed, indicating momentum is inflecting up from oversold conditions. RSI at 52.91 shows momentum re-accelerating without being stretched, leaving room to run before overbought. The technical-inflection score of 48.3 tempers the setup, but a strong trade-quality reading of 89.7 and profit-probability of 83.0 argue the risk-reward skew favors the long side on confirmation.
EntryAccumulate on strength through the 50-SMA at 253.72, or on a pullback into the 244-246 shelf that holds above the 20-day momentum zone
InvalidationDaily close below 238.00 invalidates the thesis, as it would break the mid-point between price and the 200-SMA (233.47) and signal loss of trend support
TargetsFirst target 263.50 — prior swing resistance and measured move from base → Second target 274.00 — extension objective above the 50-SMA reclaim
TimeframeSwing (2-6 weeks)
Inflection66
Probability64
Quality86
POET is trading at 8.00, sitting just 1.62% above its rising 200-SMA (7.87) while the 50-SMA at 11.69 caps upside — a classic mean-reversion inflection where the long-term trend line is being retested for support.
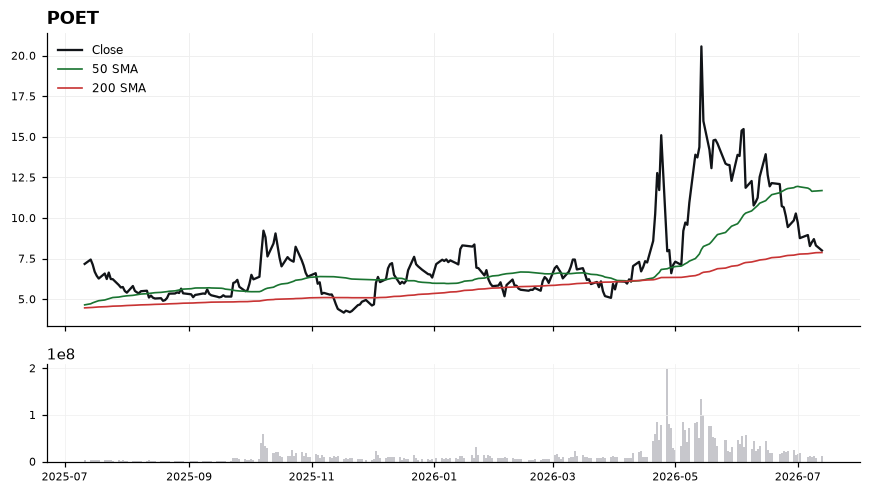
Price has pulled back sharply below the 50-SMA (11.69), leaving a ~46% gap between the two moving averages that signals oversold stretch relative to intermediate trend. RSI at 36.59 is nearing oversold without confirming capitulation, while MACD at -1.05 remains below its signal (-0.85), indicating momentum has not yet turned. The 200-SMA at 7.87 is the pivotal line-in-the-sand: holding it keeps the longer uptrend structure intact and sets up a reflex move, while losing it would flip the working bias. Trade-quality score of 85.5 reflects a favorable risk/reward geometry at this level despite unconfirmed momentum.
EntryStage entries on stabilization in the 7.90–8.10 zone above the 200-SMA, or on a momentum trigger via MACD crossing back above its signal line with price reclaiming 8.25.
InvalidationDaily close below 7.60 (a decisive break of the 200-SMA at 7.87). Losing this level invalidates the mean-reversion thesis and signals trend transition to lower.
TargetsFirst target 9.75 — midpoint back toward the 50-SMA and prior consolidation shelf. → Second target 11.60 — retest of the 50-SMA (11.69) where trend resistance is expected.
TimeframeSwing (2-6 weeks)
Inflection72
Probability56
Quality86
RKLB trades at 76.73, sitting essentially on its 200-SMA (76.91, -0.24%) after a deep pullback from the 50-SMA at 107.09 — a classic inflection where the long-term trend line is being tested and either holds or gives way.
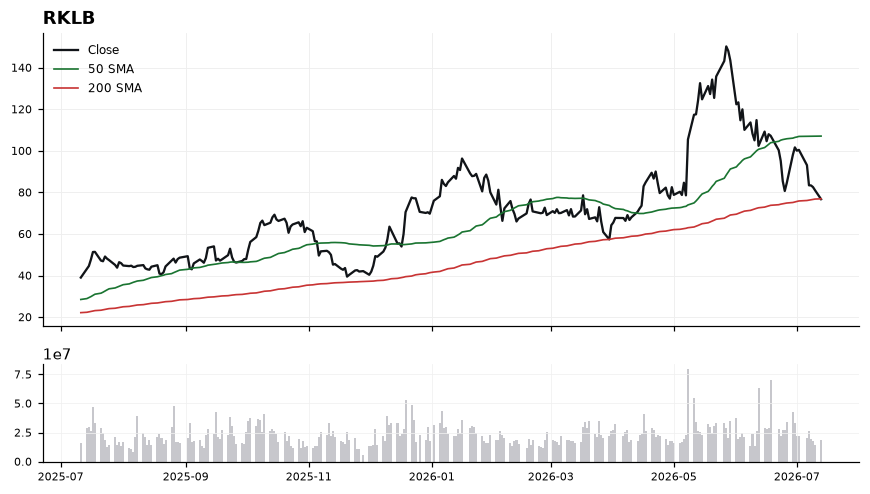
Price is roughly 28% below the 50-SMA, confirming a broken short-term uptrend, while the 200-SMA at 76.91 is acting as the last structural floor. RSI(14) at 34.96 shows waning momentum but is not yet oversold, and MACD at -7.50 remains below its signal at -5.90, indicating downside momentum is still active. The technical-inflection score of 72 reflects that this 200-SMA test is a binary pivot: a decisive break opens trend continuation lower, while a reclaim would trap late shorts.
EntryPrefer to fade rallies into 79.50–82.00, or trigger fresh shorts on a confirmed break and hourly close below 75.80 (beneath the 200-SMA).
InvalidationInvalidation on a daily close above 83.50; that would reclaim the 200-SMA with room and signal the MACD is curling up, neutralizing the short thesis.
Targets72.00 — measured move once 200-SMA gives way → 68.00 — extension target aligned with RSI pushing into oversold
TimeframeSwing (2-4 weeks)
Inflection48
Probability83
Quality87
AVGO is consolidating between its rising 200-SMA (362.67) and declining 50-SMA (406.02), sitting 5.89% above long-term trend support — a classic inflection zone where the medium-term pullback is testing the primary uptrend.
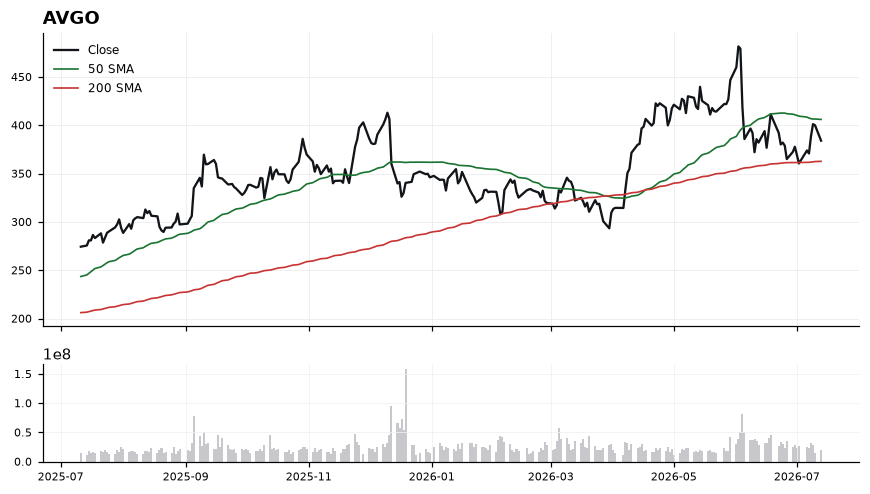
Price at 384.05 is caught below the 50-SMA (406.02) but well above the 200-SMA (362.67), signaling a corrective phase within a broader uptrend. RSI at 48.10 is neutral with room to expand, while MACD at -4.50 crossing above its signal at -7.54 indicates downside momentum is fading and turning constructive. A reclaim of the 50-SMA at 406 would confirm the momentum shift, while failure to hold above the 200-SMA at 362.67 would break the bullish structure.
EntryAccumulation zone 378–388 on stabilization, with a momentum trigger on a daily close above 395; add on reclaim of the 50-SMA at 406.02.
InvalidationDaily close below 362.50 (200-SMA) invalidates the long thesis and signals a broader trend break rather than a routine pullback.
Targets406.00 — reversion to the 50-SMA and first supply zone → 428.00 — retest of prior range highs and MACD trend-continuation objective
TimeframeSwing (2-6 weeks)
Ranked by technical inflection, profit-probability, and trade quality. Educational only. Not financial advice.