The moving average stack is constructive: price > 50-SMA > 200-SMA is a textbook bullish alignment, and the 50-SMA sits ~6.4% below spot as a dynamic support shelf. MACD at 14.82 versus signal 3.15 shows a wide positive spread, confirming momentum expansion rather than exhaustion. RSI at 63.51 is strong but not stretched (<70), leaving headroom for continuation. The primary risk is the shallow 3.01% cushion to the 200-SMA — a decisive loss of 641.73 would flip the structural read.
Tuesday Playbook — Top 5 Setups
The day's five highest-conviction setups, ranked by technical inflection, profit-probability, and trade quality — 5 long, 0 short. Trade your plan and manage risk first. Also screened: $W, $RKLB, $HPQ, $CAVA, $AVGO, $QCOM.
Inflection61
Probability83
Quality92
META trades at 661.04, sitting 3.01% above the 200-SMA (641.73) and comfortably above the 50-SMA (601.18) after reclaiming the longer-term trend line. With trade-quality scoring 91.6 and profit-probability 83.0, the setup presents a trend-continuation inflection while RSI at 63.51 leaves room before overbought.
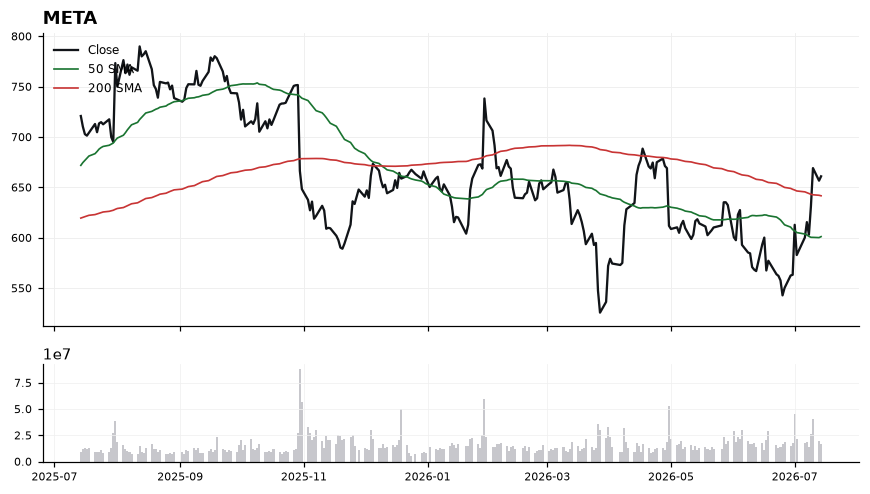
EntryPreferred accumulation on pullbacks into 648–652 (just above the 200-SMA reclaim zone); breakout add-on trigger on a close above 665.
InvalidationDaily close below 641.00 (under the 200-SMA) invalidates the long thesis, signaling failed reclaim and likely retest of the 50-SMA near 601.
TargetsFirst target 685 (measured extension of the MACD momentum thrust) → Second target 705–710 (next round-number resistance zone on trend continuation)
TimeframeSwing (2-6 weeks)
Inflection48
Probability83
Quality90
AMZN is coiling below its 50-SMA (253.37) while holding well above its rising 200-SMA (233.60), setting up a classic trend-continuation inflection as momentum turns up from oversold conditions.
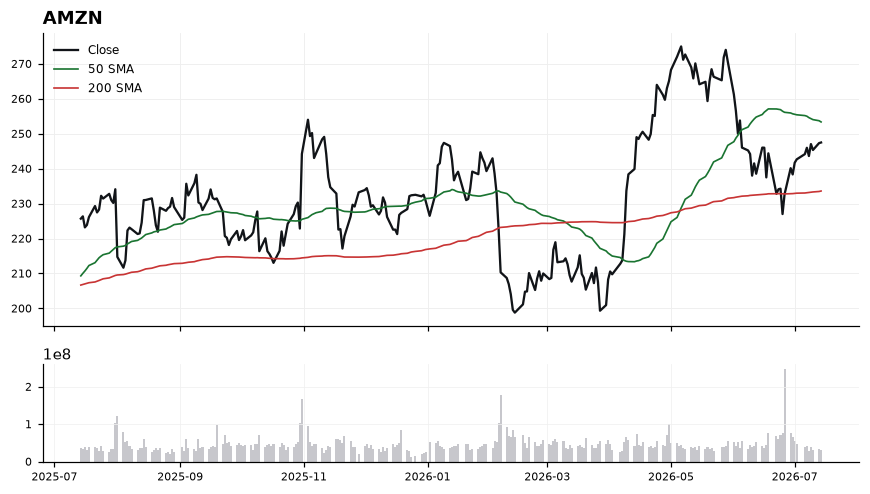
Price at 247.49 sits 2.3% under the 50-SMA (253.37) but 5.94% above the 200-SMA (233.60), keeping the primary uptrend intact. RSI at 53.10 has recovered into neutral-bullish territory without being extended, leaving room to run. MACD at -0.65 versus signal -2.40 shows a bullish crossover in progress from below zero — an early momentum inflection. The 253.37 level is the immediate hurdle; a decisive reclaim would flip the near-term structure back to trend-up.
EntryAccumulate 246-248 on stabilization; add-on trigger on a reclaim and close above the 50-SMA at 253.37.
InvalidationDaily close below 240.00 invalidates the setup by breaking the recent base and opening a path back toward the 200-SMA at 233.60.
Targets258.50 — prior swing / first resistance above the 50-SMA → 265.00 — measured extension of the MACD-cross momentum leg
TimeframeSwing (2-6 weeks)
Inflection35
Probability98
Quality87
NVDA is coiling just above its rising 50-SMA (209.33) with price at 211.80, sitting 10.33% above the 200-SMA (191.97) — a classic pullback-to-trend setup where the working long bias needs confirmation before momentum re-engages.
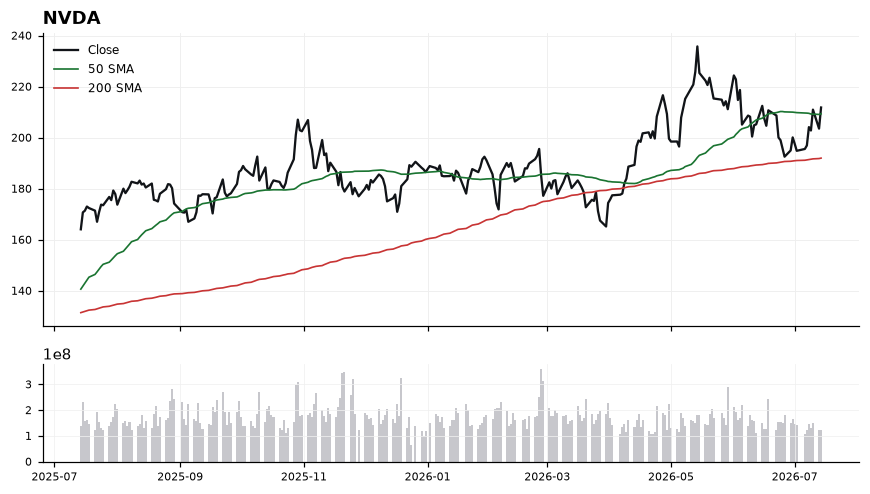
Price is holding the 50-SMA as dynamic support, with the broader trend intact given the wide 10.33% cushion over the 200-SMA at 191.97. RSI at 56.39 is constructive but not extended, leaving room to run before overbought conditions. MACD at -0.59 versus a signal of -2.26 shows a bullish crossover in progress, though still sub-zero, signaling momentum is turning but not yet confirmed. The technical-inflection score of 35.4 corroborates that this is an early-stage setup rather than a fully triggered breakout.
EntryAccumulation zone 209.33–212.00 on tests of the 50-SMA; confirmation trigger on a close above 213.50 to signal momentum acceptance.
InvalidationInvalidation on a decisive close below 205.00; a break here forfeits the 50-SMA shelf and opens a drift toward the 200-SMA at 191.97.
TargetsFirst target 222.00 (prior swing supply, ~+4.8% from spot) → Second target 232.00 (measured move extension on MACD zero-line reclaim)
TimeframeSwing (2-6 weeks)
Inflection51
Probability83
Quality83
RH trades at 174.55, extended 6.05% above the 200-SMA (164.59) and 19% above the 50-SMA (146.63), with the 50-SMA having reclaimed the 200-SMA — a bullish structural alignment that puts the tape at an inflection between trend continuation and mean-reversion after an extended run.
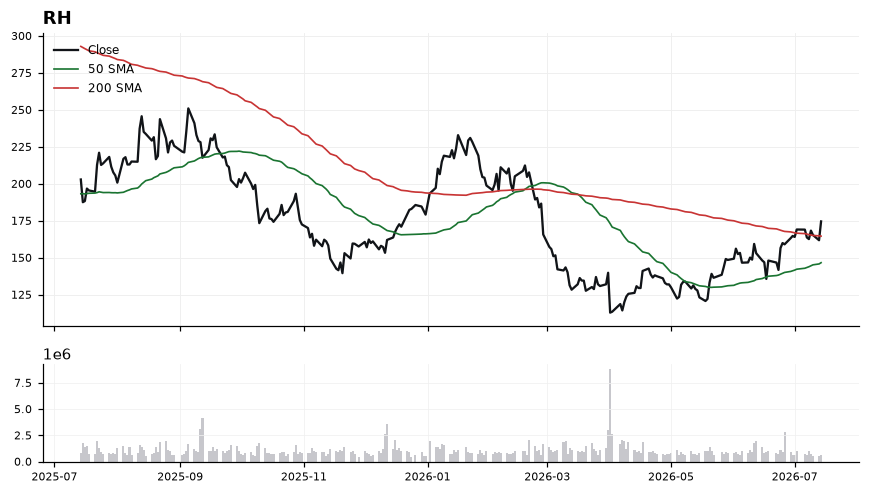
Price sits above both moving averages, confirming a constructive trend backdrop, while RSI(14) at 64.03 is firm but not yet overbought, leaving room before the 70 threshold. MACD at 6.14 remains above its signal at 5.80, but the narrow 0.34 spread suggests momentum is decelerating even as it holds positive. With the technical-inflection score at 50.9 versus a trade-quality of 82.6, the trend is intact but chase risk is elevated this far above the 200-SMA.
EntryPrefer staggered entries on a pullback into 168–170 (near prior breakout shelf) or a momentum add on a decisive close above 176.50; avoid initiating in the 174–176 zone at the current extension.
InvalidationInvalidation on a close below 164.50, which would break the 200-SMA and negate the reclaim, flipping the structural bias.
Targets182.00 as the first measured extension from the 50/200-SMA cross → 190.00 on continuation as RSI pushes toward overbought
TimeframeSwing (2-6 weeks)
Inflection38
Probability98
Quality81
SPY at 751.83 sits in an established uptrend with price stacked above both the 50-SMA (742.65) and 200-SMA (695.37), but momentum is only mid-range (RSI 56), framing a continuation-vs-consolidation decision point rather than a fresh breakout.
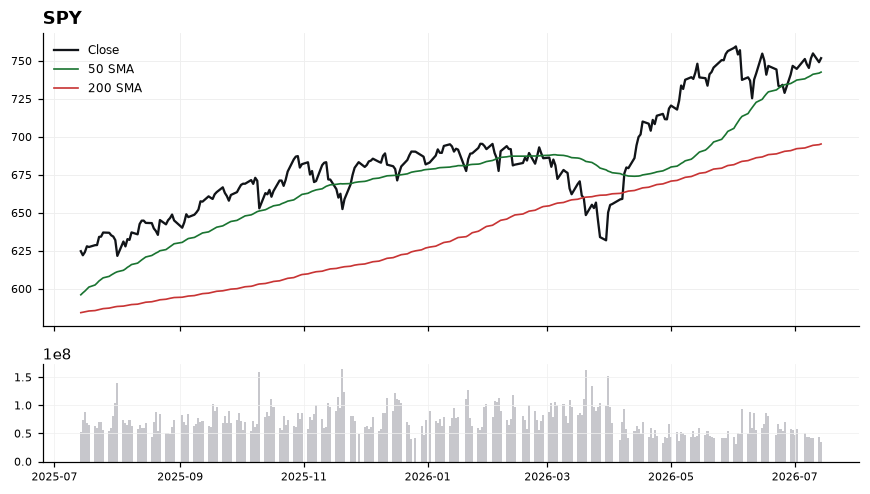
The trend structure is constructive: price is 1.2% above the rising 50-SMA and 8.12% above the 200-SMA, confirming a healthy long-term bias without extreme extension. MACD at 3.30 above its 3.30/2.60 signal line points to positive momentum, and RSI at 56.04 leaves room to run before overbought territory. The 50-SMA at 742.65 is the key near-term pivot, while the low technical-inflection score (37.9) suggests limited edge for aggressive new entries at spot; the trade-quality of 81.2 favors disciplined pullback buys.
EntryPrefer staggered longs on pullbacks into 745-748 (just above 50-SMA); a momentum add can be considered on a decisive close above 754-755.
InvalidationClose below 742.00 (under the 50-SMA); breaking that shifts the short-term structure and opens a mean-reversion path toward the 200-SMA.
Targets758-762 as initial continuation target → 770-775 as extended swing objective
TimeframeSwing (2-6 weeks)
Ranked by technical inflection, profit-probability, and trade quality. Educational only. Not financial advice.