Trend structure is turning constructive: the 50-SMA at 145.18 sits well below price, and the 20%+ gap between the 50- and 200-day averages signals momentum recovery from lower levels. RSI at 58.93 is firm but not overbought, leaving room to extend, while MACD at 6.08 above its 5.74 signal line confirms an active bullish crossover. The key tell is whether price can hold above the 200-SMA (165.06) and convert it from resistance to support.
Sunday Playbook — Top 5 Setups
The day's five highest-conviction setups, ranked by technical inflection, profit-probability, and trade quality — 5 long, 0 short. Trade your plan and manage risk first. Also screened: $MDB, $IBM, $SPY, $CAVA, $W, $TSLA.
Inflection68
Probability83
Quality87
RH is pressing right at its 200-day SMA (165.06) with price at 165.35, just 0.17% above the long-term trend line — a textbook inflection where a reclaim attempt is underway but not yet confirmed.
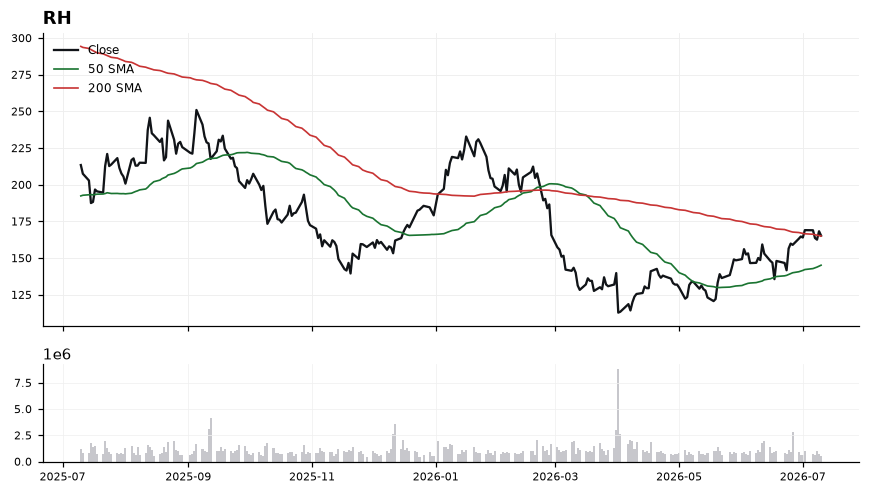
EntryPreferred entry on a hold/reclaim between 165.00–166.50, or on a pullback toward the 160–162 zone that respects the rising 50-SMA structure.
InvalidationBelow 158.00 — a close under this level would break back beneath the 200-SMA decisively and invalidate the reclaim thesis, reverting bias to neutral.
Targets178.00 — first measured extension as momentum carries above the 200-SMA reclaim → 188.50 — second target on continuation as MACD spread widens
TimeframeSwing (2-6 weeks)
Inflection59
Probability78
Quality91
META trades at 669.21, extended 4.12% above its rising 200-SMA (642.72) and 11.4% above the 50-SMA (600.45), with momentum confirming the long bias as the working thesis. The inflection is a fresh MACD expansion (8.49 vs -2.69 signal) into an RSI of 66.34 — strong but approaching the overbought threshold.
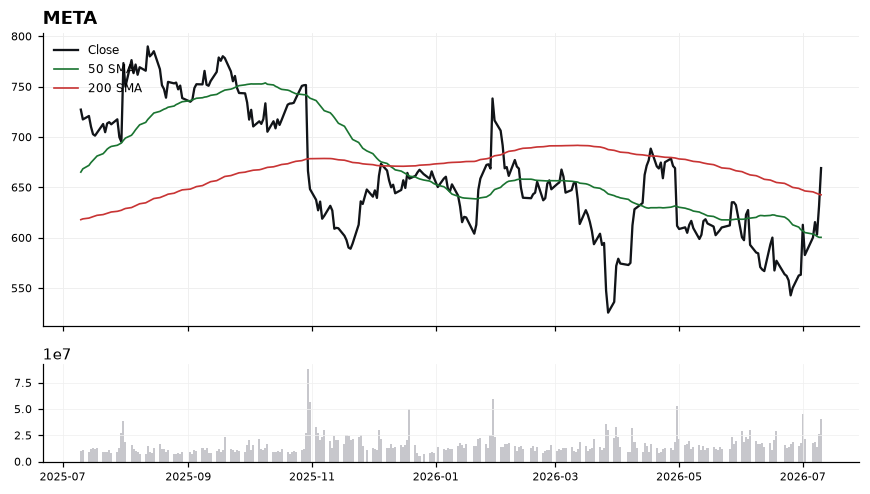
The trend structure is constructive: price > 50-SMA > 200-SMA, with the 50-SMA still curling up toward the 200-SMA, a bullish alignment. MACD's ~11-point spread above signal points to accelerating momentum, but RSI at 66.34 leaves limited runway before the 70 line, raising the odds of a shallow pullback to retest broken resistance. The 642.72 (200-SMA) level now becomes primary support on any mean-reversion move, with the 600.45 (50-SMA) as the deeper structural floor. Trade-quality (90.9) and profit-probability (78.0) are elevated, but technical-inflection at 59.3 signals we are mid-move, not at a fresh base breakout.
EntryPreferred add/initiate zone on a pullback to 650–655 (just above the 200-SMA reclaim shelf); a secondary momentum trigger is a daily close above 675 confirming continuation. Avoid chasing above 685 without a consolidation.
InvalidationDaily close below 642.00, which would forfeit the 200-SMA and invalidate the reclaim thesis, opening a path back toward the 50-SMA at 600.45.
TargetsFirst target 690–695 (measured continuation of current MACD impulse) → Second target 715–720 (extension objective if RSI resets from a shallow pullback)
TimeframeSwing (2-6 weeks)
Inflection46
Probability98
Quality82
HPQ trades at 24.22, holding above both the 50-SMA (23.28) and 200-SMA (22.57) with a bullish MACD crossover (-0.06 vs -0.15) taking shape — a classic long-bias inflection where momentum is turning up from below zero while price is 7.3% extended over the 200-day.
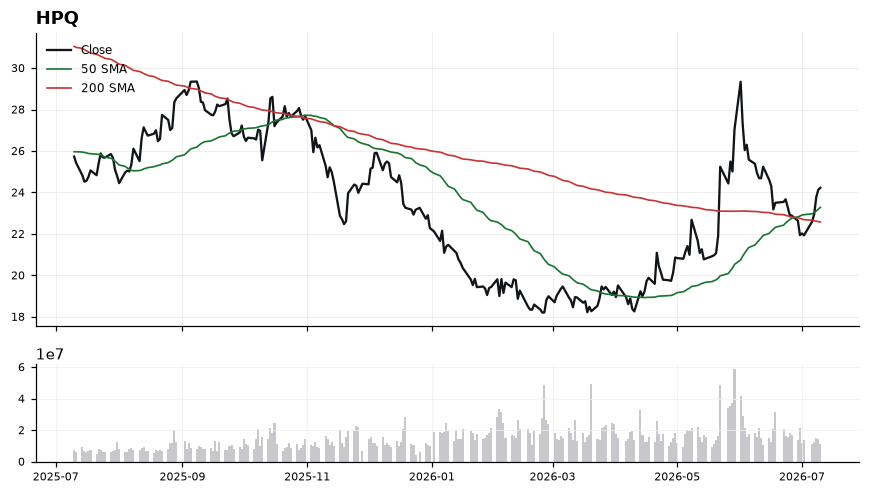
The stack is constructive: 50-SMA above 200-SMA and price above both confirms an intact uptrend structure. RSI at 56.78 is firmly bullish but not overbought, leaving room to run before demand exhaustion. MACD closing the gap to signal from below zero signals momentum is re-accelerating, though the negative absolute value shows the thrust is still nascent. The 7.30% cushion over the 200-SMA is healthy but not stretched, keeping risk/reward workable.
EntryPreferred accumulation zone 23.80-24.25 on constructive pullbacks toward the 50-SMA; alternatively, a momentum add on a decisive close above 24.50 with MACD crossing positive.
InvalidationBelow 23.20, just under the 50-SMA. A break here would invalidate the near-term inflection and re-open the path toward the 200-SMA at 22.57.
Targets25.40 — prior swing resistance zone and first measured extension from the 50-SMA base → 26.60 — extended target reflecting continuation of the trend with RSI room to 65-70
TimeframeSwing (2-6 weeks)
Inflection50
Probability83
Quality90
AMZN is coiling between its rising 200-SMA (233.33) and declining 50-SMA (254.03), with price at 245.34 sitting mid-range as MACD (-1.52 vs -3.28) crosses higher from below zero — an early inflection signal that has yet to be confirmed by momentum, given RSI is neutral at 50.93.
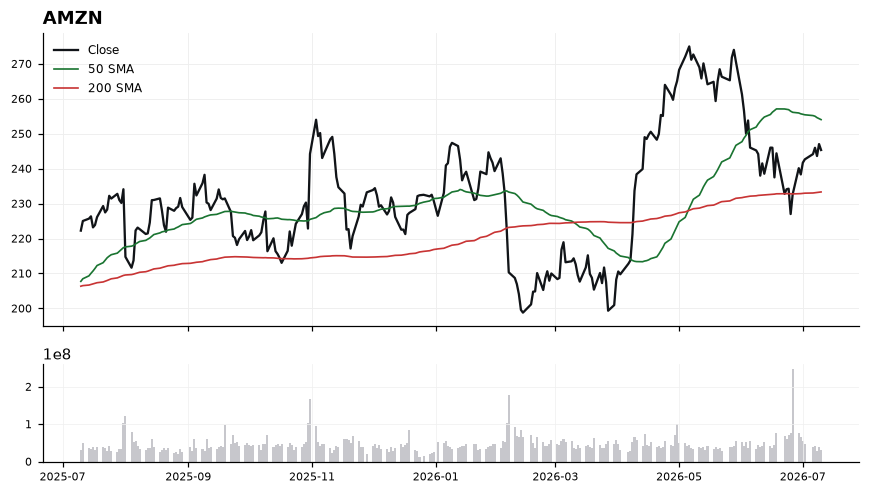
Price trades 3.5% below the 50-SMA but a healthy 5.15% above the 200-SMA, keeping the longer-term uptrend intact while the intermediate trend rolls. The MACD histogram is expanding positively (spread of +1.76) even though both lines remain negative, suggesting downside momentum is fading rather than reversing. RSI at 50.93 has reclaimed the midline but shows no thrust, so the tape favors accumulation on weakness rather than chasing strength. The 254.03 level (50-SMA) is the pivotal resistance that must be reclaimed to validate the long bias reflected in the 83 profit-probability and 90 trade-quality scores.
EntryScale-in zone 242.00–246.00 near current price, with a confirmation add on a daily close above the 50-SMA at 254.03.
InvalidationDaily close below 233.33 (200-SMA); breaking this flips the longer-term trend structure and invalidates the accumulation thesis, exposing price to a deeper reset.
Targets254.00 — reclaim of the 50-SMA and gap-fill toward prior consolidation → 265.00–268.00 — measured extension above the 50-SMA once momentum confirms
TimeframeSwing (2–6 weeks)
Inflection37
Probability98
Quality87
NVDA is coiling just above its 50-SMA (209.20) with the working bias long, sitting 10.06% above the rising 200-SMA (191.67) — a classic trend-continuation inflection where price is testing whether the near-term moving average holds as support.
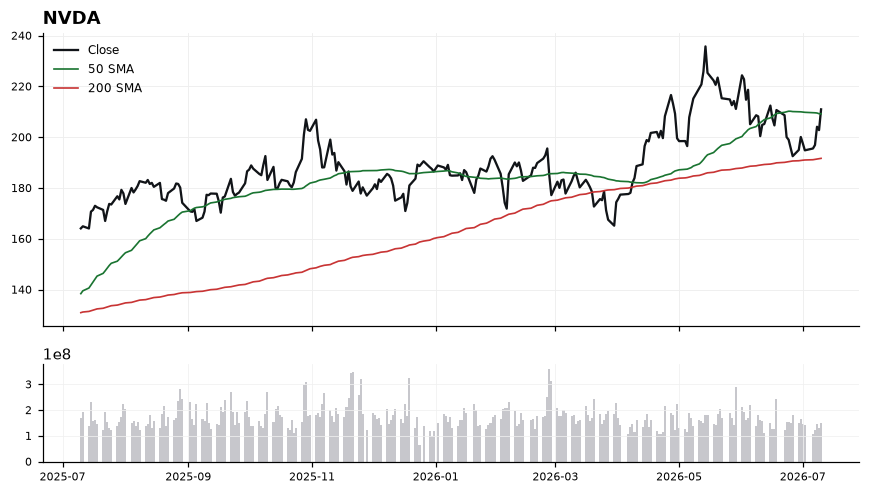
Price at 210.96 is pressed against 50-SMA support at 209.20, with the broader uptrend framed by the 200-SMA at 191.67. RSI(14) at 56.97 is constructive but not yet overbought, leaving room to extend. MACD at -1.74 versus signal -2.98 shows a bullish crossover developing from below zero, suggesting momentum is turning up but has not fully confirmed. The 36.8 technical-inflection score indicates the setup is mid-development rather than fully triggered.
EntryAccumulate on strength above 211.00 with confirmation on a close over 213.50; alternative pullback entry into the 209.20–210.00 zone (50-SMA retest).
InvalidationDaily close below 205.00 invalidates the setup — this would break the 50-SMA decisively and threaten a full retrace toward the 200-SMA at 191.67.
TargetsFirst target 220.00 (near-term extension above current range) → Second target 228.50 (measured continuation of the primary uptrend)
TimeframeSwing (2-6 weeks)
Ranked by technical inflection, profit-probability, and trade quality. Educational only. Not financial advice.