Price at 966.58 sits fractionally below the 50-SMA (968.75) but 0.96% above the rising 200-SMA (957.42), keeping the longer-term structure intact. MACD at -5.21 versus signal -10.19 shows a bullish crossover developing from below zero, consistent with an early momentum turn. RSI at 57.37 is constructive without being extended, leaving room for continuation. The technical-inflection score of 69 and trade-quality of 80.4 corroborate a setup that is actionable rather than mature.
Tuesday Playbook — Top 5 Setups
The day's five highest-conviction setups, ranked by technical inflection, profit-probability, and trade quality — 4 long, 1 short. Trade your plan and manage risk first. Also screened: $HD, $META, $IGV, $AAOI, $ALGN, $HIMS.
Inflection69
Probability83
Quality80
COST is coiling directly at its 50-SMA (968.75) while holding just above the 200-SMA (957.42), a compression zone where a resolution is imminent given the improving momentum backdrop.
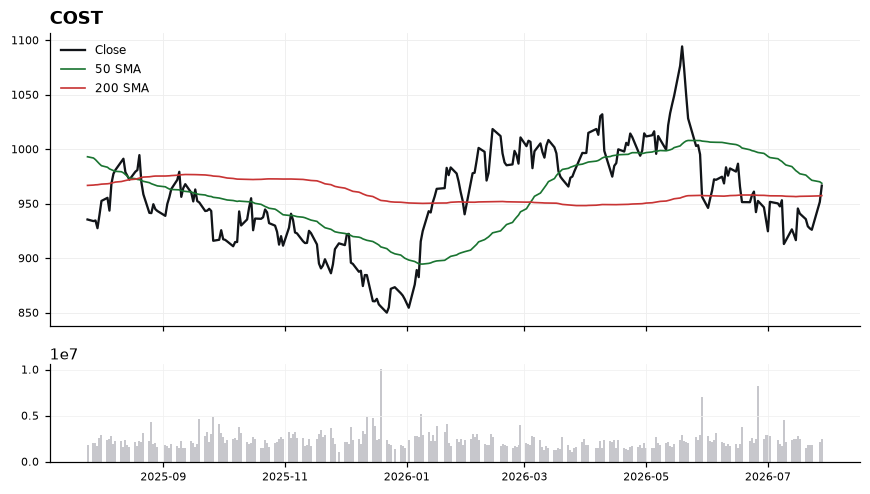
EntryPreferred trigger on a reclaim and 15-min close above the 50-SMA at 968.75; secondary add on a pullback that holds the 960-962 shelf above the 200-SMA.
InvalidationInvalidation on a daily close below 957.42 (200-SMA); a break there would negate the higher-low structure and flip trend bias to neutral/negative.
TargetsFirst objective near 985, capturing the mean-reversion move once above the 50-SMA → Second objective near 1,000 psychological level as momentum extension
TimeframeSwing (2-6 weeks)
Inflection54
Probability83
Quality88
AVGO trades at 380.91, wedged between its rising 200-SMA at 365.34 (+4.26% cushion) and a declining 50-SMA at 397.50 that now caps the tape. With RSI at 47.43 and MACD (-2.04) curling above its signal (-2.89), the setup is at a momentum inflection where a reclaim of the 50-SMA would flip the near-term trend structure.
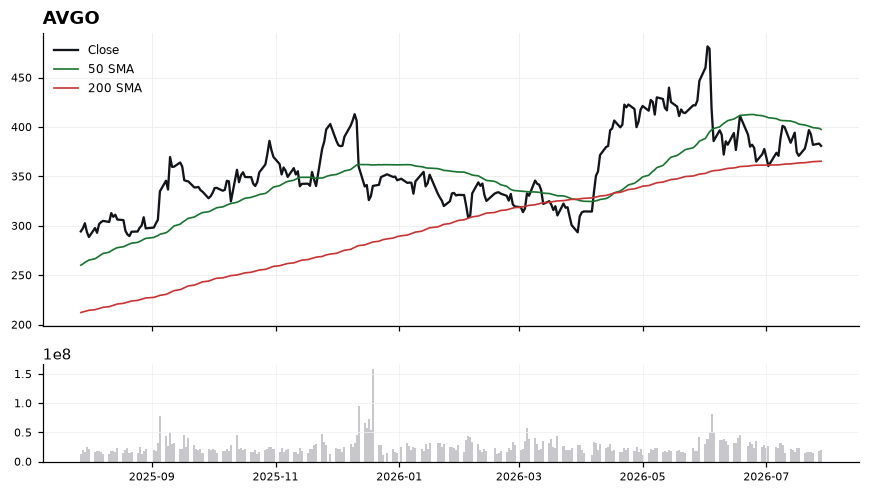
Price sits below the 50-SMA (397.50) but comfortably above the 200-SMA (365.34), a classic mid-range consolidation inside a longer-term uptrend. RSI at 47.43 is neutral with room to expand before overbought conditions, while the MACD histogram is narrowing as the line crosses above signal — an early, unconfirmed positive momentum shift. The 4.26% buffer to the 200-SMA is the key structural support keeping the working long bias intact. Trade-quality (87.8) and profit-probability (83.0) scores are strong, but technical-inflection at 53.9 argues for confirmation rather than anticipation.
EntryTiered accumulation: initial tranche 378–382 on stabilization; add on a confirmed reclaim of the 50-SMA with a close above 398. Alternatively, pullback entry into 368–372 near the 200-SMA if broader tape weakens first.
InvalidationDaily close below 363 (under the 200-SMA at 365.34). Losing that level invalidates the mid-range long thesis and signals a shift from consolidation to a lower-high, lower-low structure.
TargetsFirst target: 397–400 (reversion to the 50-SMA / prior supply) → Second target: 415–420 (extension above the 50-SMA on trend re-acceleration)
TimeframeSwing (2-6 weeks)
Inflection60
Probability69
Quality92
NVDA is coiling just above its rising 200-SMA (193.00) while trading below the 50-SMA (207.82), a classic mean-reversion inflection where a Long bias must be defended at the long-term trend line or abandoned. With price only 2.08% above the 200-SMA and momentum still soft, the tape is compressing into a decision point.
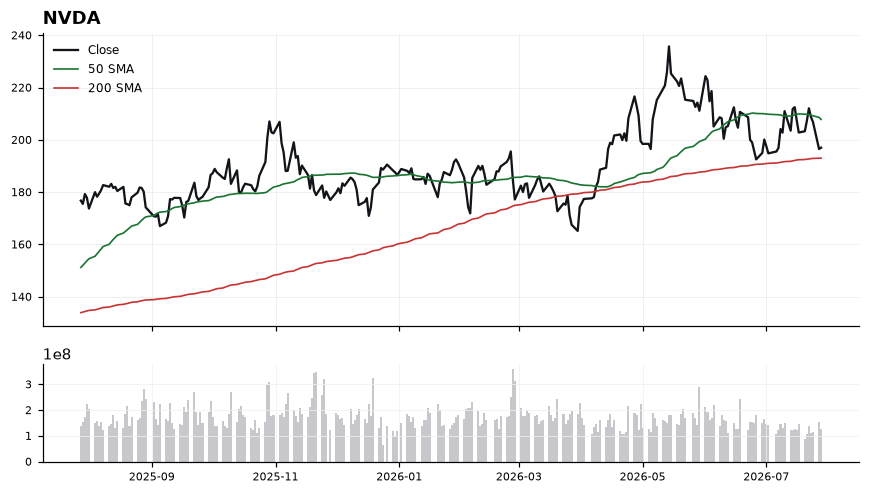
Price at 197.01 sits in no-man's land between the 200-SMA support at 193.00 and 50-SMA resistance at 207.82, framing a ~10.8-point battle zone. RSI at 42.95 is sub-50 but not oversold, signaling weak momentum rather than capitulation, while MACD at -0.66 versus signal -0.09 confirms bearish momentum is still expanding. The trade-quality score (92.2) and profit-probability (69.0) argue the structure is favorable, but the technical-inflection reading (59.8) says we need confirmation, not anticipation. Reclaiming the 50-SMA would flip the near-term posture; losing the 200-SMA breaks the multi-month uptrend thesis.
EntryStaged accumulation on a hold of the 200-SMA: initial tranche 193.50-195.50 on stabilization, add-on trigger above 200.00 with MACD histogram turning up toward the signal line.
InvalidationDaily close below 190.50 (roughly 1.3% under the 200-SMA); breaking it invalidates the long-term uptrend structure and shifts bias to neutral/short.
TargetsFirst target 207.50, just under the 50-SMA where sellers are likely to re-engage → Second target 215.00-217.00 on a clean 50-SMA reclaim, restoring the prior trend
TimeframeSwing (2-6 weeks)
Inflection58
Probability69
Quality92
GOOGL sits at 333.71, wedged between reclaimed 200-SMA support at 324.75 and lost 50-SMA resistance at 361.84 — a classic mean-reversion inflection where a MAG7 leader is testing whether its longer-term trend still holds.
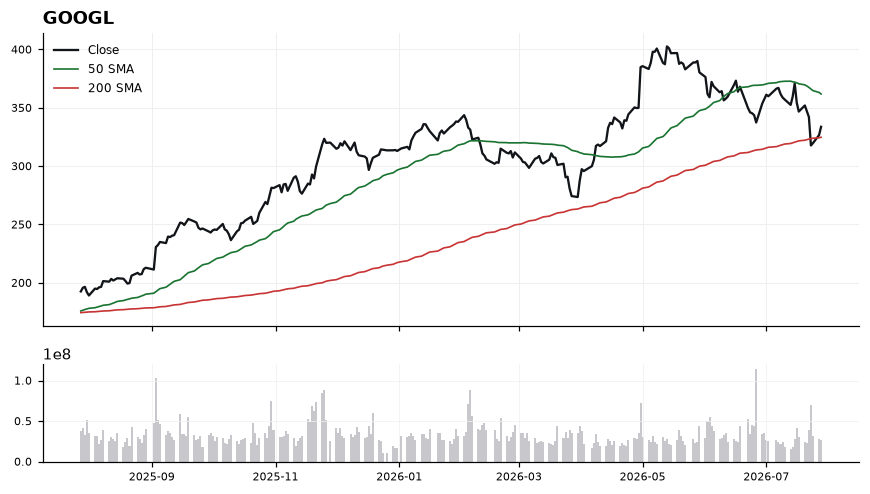
Price is only 2.76% above the 200-SMA, marking the nearest structural floor and the line-in-the-sand for the working long bias. RSI at 41.71 signals waning momentum without confirmed oversold capitulation, while MACD at -8.74 versus signal -5.91 shows the histogram still negative and widening — momentum has not yet turned. The 50-SMA at 361.84 now caps rallies, defining an 8-9% band between reclaim-support and breakdown-resistance that must resolve.
EntryStage entries into the 324.75–330.00 zone on stabilization; a momentum add-on trigger requires MACD crossing back above signal AND price reclaiming 345.00
InvalidationDaily close below 320.00 invalidates the setup — it would confirm loss of the 200-SMA and flip the intermediate trend from consolidation to breakdown
TargetsFirst target 361.84 (50-SMA reclaim test) → Second target 378.00 on a clean 50-SMA breakout and MACD bullish cross
TimeframeSwing (2-6 weeks)
Inflection66
Probability56
Quality93
AMZN is pressing the underside of its 200-SMA at 234.66 while trading 6.8% below its 50-SMA at 247.72, marking an inflection where a failed reclaim of the 200-day would confirm the working short bias.
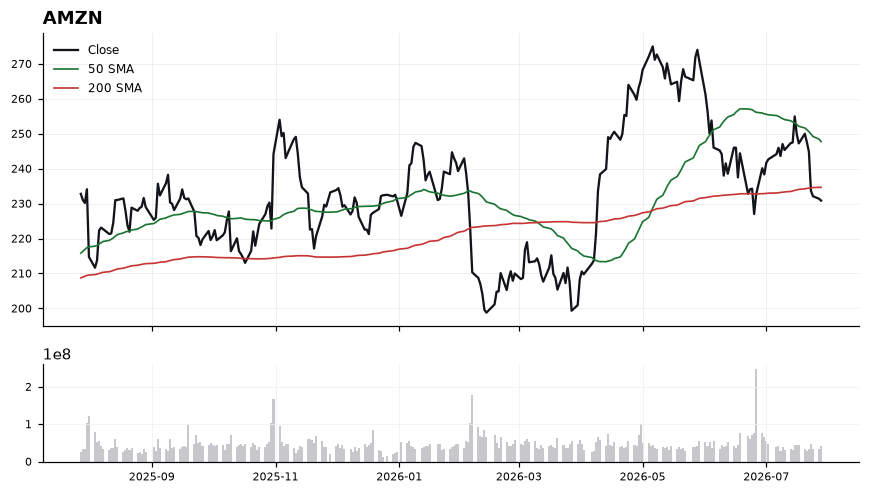
Price at 230.86 sits -1.62% beneath the 200-SMA, and the 50-SMA above 200-SMA reflects a still-intact longer-term uptrend now being tested. RSI(14) at 36.54 shows expanding downside momentum without being oversold, leaving room for further downside before mean-reversion pressure builds. MACD at -2.94 versus signal -1.27 is negative and widening, corroborating the loss of trend and favoring rallies into resistance rather than breakout continuation.
EntryFade strength into the 234.66 (200-SMA) to 238.00 zone; alternatively, add on a momentum break below 229.50 that fails to reclaim the 200-SMA on a retest.
InvalidationInvalidation on a daily close above 240.00, which would reclaim the 200-SMA convincingly and neutralize the MACD downtrend structure.
Targets222.50 — prior consolidation shelf and first measured move from the 50/200 SMA compression → 215.00 — extension target aligning with a deeper mean-reversion away from the 200-SMA
TimeframeSwing (2-6 weeks)
Ranked by technical inflection, profit-probability, and trade quality. Educational only. Not financial advice.