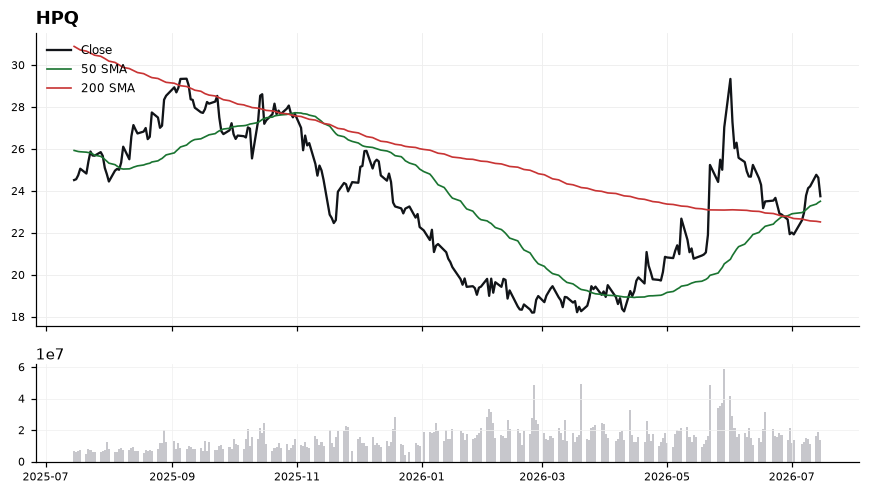
Price is stacked constructively above both moving averages, confirming an intact intermediate uptrend with the 200-SMA at 22.52 acting as a deeper structural floor. The 50-SMA at 23.51 is the immediate pivot — holding this level keeps the bullish MACD crossover credible. RSI at 51.19 signals momentum has reset without becoming overbought, offering runway before resistance filters engage. However, the technical-inflection score of 43.8 warns the breakout is not yet fully confirmed and needs a decisive push through recent highs.
Wednesday Playbook — Top 5 Setups
The day's five highest-conviction setups, ranked by technical inflection, profit-probability, and trade quality — 4 long, 1 short. Trade your plan and manage risk first. Also screened: $NVDA, $MDB, $CAVA, $QCOM, $HD, $AVGO.
Inflection44
Probability98
Quality83
HPQ is coiling just above its 50-SMA (23.51) with price at 23.75, holding a modest 5.44% cushion over the rising 200-SMA (22.52). The setup sits at an inflection as MACD has crossed above signal (0.13 vs -0.02) while RSI (51.19) remains neutral, leaving room for directional expansion.
EntryAccumulate on strength above 23.80, or on a controlled pullback into the 23.50–23.60 zone that holds the 50-SMA
InvalidationClose below 22.95; a break there voids the MACD signal and exposes a retest of the 200-SMA at 22.52
Targets24.60 — reclaim of prior swing supply → 25.40 — measured extension of the current base
TimeframeSwing (2-6 weeks)
Inflection38
Probability98
Quality88
AMZN is grinding higher within an established uptrend, trading at 254.96 just above its rising 50-SMA (253.10) and 9.06% above the 200-SMA (233.79). With MACD (0.26) crossing above its signal (-1.86) and RSI at 60.14, momentum is inflecting positively without yet reaching overbought extremes.
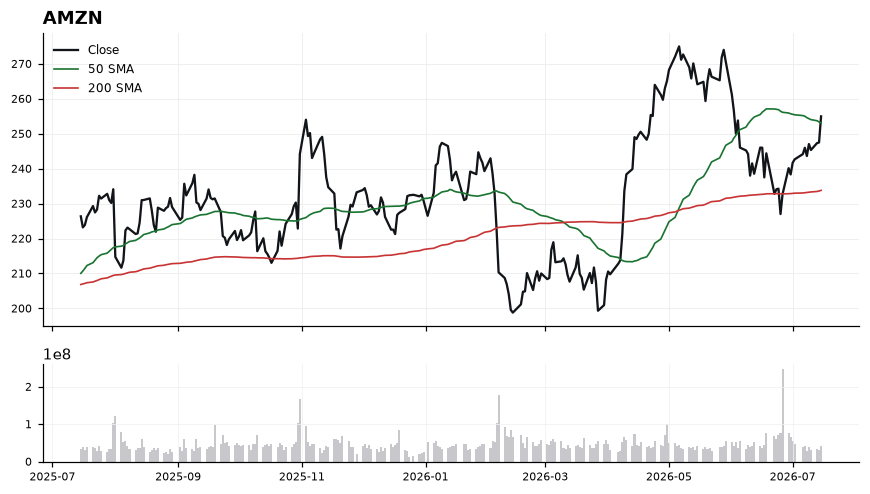
Price is holding the 50-SMA as dynamic support, confirming the stack of price > 50-SMA > 200-SMA typical of a healthy long trend. The MACD histogram flipping positive after a deep signal-line gap (spread of ~2.1) marks a fresh momentum thrust, while RSI at 60 leaves room before the 70 overbought threshold. The 9.06% cushion to the 200-SMA indicates trend maturity but not stretched extension, and the trade-quality score (87.6) alongside high profit-probability (98.0) supports the constructive read despite a modest technical-inflection score (37.6).
EntryPreferred accumulation on pullbacks into 253.00–254.00 (50-SMA retest); breakout add-on trigger on a close above 256.00.
InvalidationDaily close below 249.50 invalidates the setup — this would break the 50-SMA support and signal momentum failure, opening risk toward the 200-SMA.
Targets263.50 (measured extension from the MACD cross) → 272.00 (trend continuation objective)
TimeframeSwing (2-6 weeks)
Inflection52
Probability78
Quality90
META trades at 681.31, extended 6.22% above its 200-SMA (641.39) and 13.0% above its 50-SMA (602.63), with a bullish 50/200 alignment supporting the Long working bias. The inflection sits at whether momentum can absorb an RSI of 66.80 — near overbought — without triggering a mean-reversion pullback toward moving-average support.
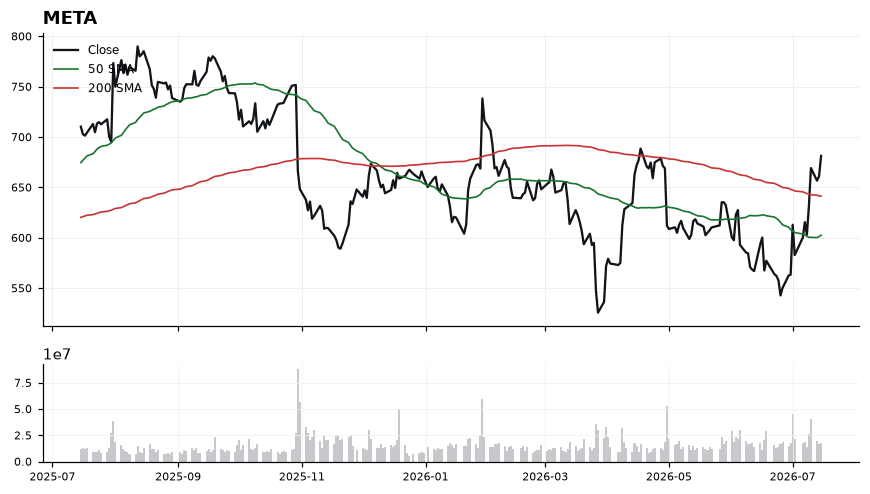
Trend structure is constructive: price > 50-SMA > 200-SMA, and MACD at 18.54 sits well above its signal at 6.23, confirming positive momentum expansion. However, RSI(14) at 66.80 is approaching the 70 threshold, suggesting limited near-term cushion for chasing strength. The 641.39 (200-SMA) and 602.63 (50-SMA) act as tiered dynamic support, while the 6.22% gap to the 200-SMA leaves the tape stretched enough that pullback entries are preferable to breakout chases. Trade-quality (89.5) and profit-probability (78.0) are strong, but the technical-inflection score of 52.3 argues for patience on timing.
EntryPreferred accumulation zone 655–668 on a pullback that resets RSI toward the high-50s; secondary trigger on a reclaim/close back above 685 if strength persists without a pullback.
InvalidationDaily close below 641 (200-SMA). A break there voids the 'above rising 200-SMA' thesis and opens a mean-reversion path toward the 50-SMA at 602.
Targets705–712 as the first measured extension of current momentum → 735–745 if MACD stays above signal and RSI holds >60 on any pullback
TimeframeSwing (2-6 weeks)
Inflection38
Probability98
Quality81
SPY at 754.81 sits above both the 50-SMA (743.34) and 200-SMA (695.85), extending an established uptrend, but with an inflection score of only 38.1 the setup is a trend-continuation read rather than a fresh breakout — the 'inflection' is whether pullbacks into the 50-SMA get bought.
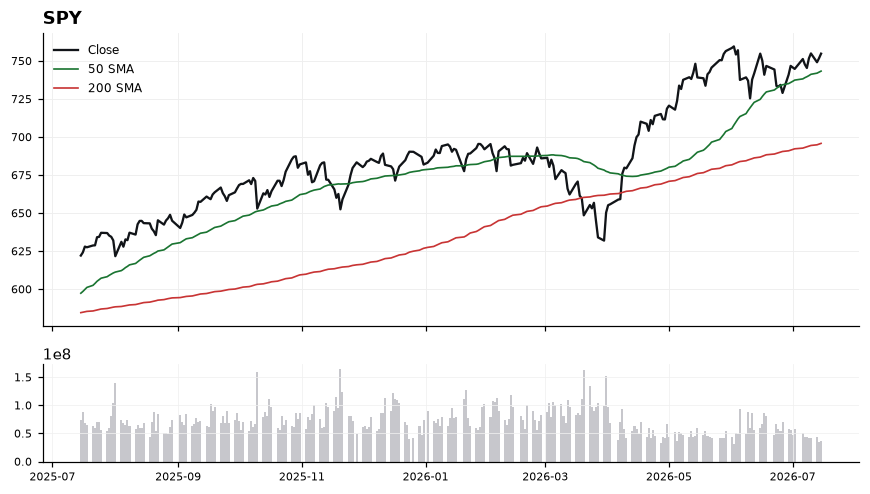
Trend structure is constructive: price is +1.5% over the 50-SMA and +8.47% above the 200-SMA, confirming intermediate and long-term uptrends. RSI(14) at 58.04 is bullish but not overbought, leaving room to extend. MACD at 3.61 remains above its signal at 2.80, a positive momentum spread, though the modest gap suggests momentum is steady rather than accelerating. Working bias stays long while price holds the 743–744 shelf.
EntryPreferred entry on pullbacks into 745–748 (just above the 50-SMA at 743.34); a secondary momentum trigger is a decisive close above 758 to signal continuation.
InvalidationClosing break below 742 invalidates the setup — it would breach the 50-SMA and signal the trend-following structure has cracked, opening the path back toward the 200-SMA near 695.85.
TargetsFirst target 765–768, extension of current momentum leg → Second target 775–780 as measured continuation of the trend above the 50-SMA
TimeframeSwing (2-6 weeks)
Inflection68
Probability56
Quality86
RKLB is pressing into its 200-day SMA at 77.21 with price at 76.20, having already broken beneath it by 1.31% — a classic inflection where the long-term trend line is being retested from below after a steep decline from the 50-SMA at 106.96.
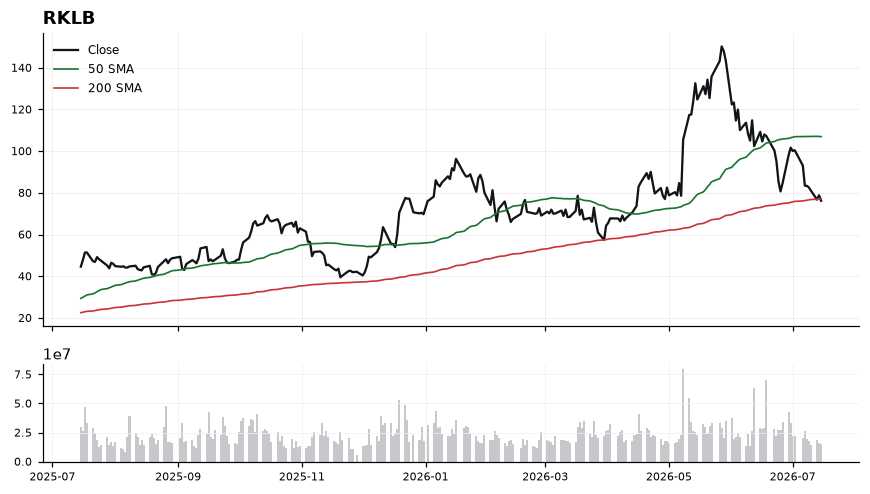
The 50-SMA sits nearly 29 points above spot, confirming a clearly broken intermediate uptrend, while price now trades marginally below the 200-SMA (77.21), turning that level into first overhead resistance. MACD at -7.99 remains below its signal at -6.61, indicating momentum is still deteriorating rather than curling up. RSI at 35.49 is weak but not yet oversold, leaving room for further downside before a mechanical bounce trigger. The setup favors the short bias unless price reclaims and holds above the 200-SMA.
EntryShort on failed retests into 77.20–78.50 (reclaim attempts of the 200-SMA), or on momentum continuation below 75.80.
InvalidationInvalidation on a daily close above 79.50; that would signal a reclaim of the 200-SMA and negate the breakdown thesis, opening room back toward the 50-SMA.
Targets72.50 — measured continuation below the 200-SMA where RSI would likely reach oversold → 68.00 — extended target aligned with prior consolidation zone and a deeper trend-break confirmation
TimeframeSwing (2-6 weeks)
Ranked by technical inflection, profit-probability, and trade quality. Educational only. Not financial advice.