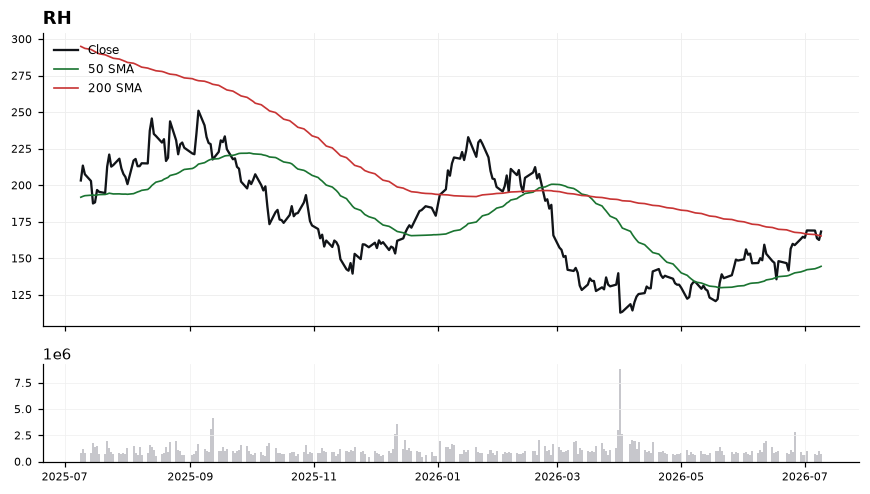
The 50-SMA at 144.53 sits well below the 200-SMA at 165.32, so the golden-cross has not yet formed, but momentum is turning: MACD at 6.28 is above its signal at 5.65 and RSI at 62.22 is firmly bullish without being overbought. Price holding above the 200-SMA is the pivotal tell — a decisive close back below 165.32 would neutralize the reclaim. The 23-point gap between the 50- and 200-SMA also flags that any failure here could see mean-reversion pressure toward the rising 50-SMA.
Thursday Playbook — Top 5 Setups
The day's five highest-conviction setups, ranked by technical inflection, profit-probability, and trade quality — 5 long, 0 short. Trade your plan and manage risk first. Also screened: $TSLA, $W, $IBM, $ALGN, $CAVA, $ETOR.
RH is grinding higher through its 200-SMA (165.32) with price at 168.33, just 1.82% above the long-term trend line — a classic reclaim setup where the prior ceiling now attempts to become the floor.
HPQ is trading at 24.13, above both its 50-SMA (23.19) and 200-SMA (22.59), with the shorter average now stacked above the longer — a constructive alignment that supports the working long bias. The inflection sits in MACD, which at -0.16 has just crossed above its signal (-0.17), hinting at momentum turning back up while RSI at 56 leaves room before overbought.

Price is 6.80% above the 200-SMA, a healthy but not stretched extension that keeps the longer-term trend intact. The 50-SMA at 23.19 has flipped into dynamic support and the 200-SMA at 22.59 marks the deeper structural floor. RSI(14) at 56.16 shows positive but not euphoric momentum, and the fresh MACD cross above signal (-0.16 vs -0.17) is an early, still-fragile confirmation rather than a decisive thrust — hence the modest technical-inflection score of 47.6 despite a high trade-quality read of 82.1.
AMZN is coiling between a reclaimed 200-SMA (233.24) and a rejected 50-SMA (254.32), with price at 247.04 sitting 5.91% above its long-term trend — a classic mid-range inflection where the next SMA resolution likely sets the swing bias.

The tape is constructive but unproven: RSI at 52.71 is neutral-with-upward-drift, and MACD at -1.90 has crossed above its signal at -3.71, signaling momentum inflection off recent lows. However, price remains 7.28 points below the 50-SMA (254.32), which caps the tape until reclaimed. The 200-SMA at 233.24 defines the structural floor, and the 5.91% cushion gives room to work without immediately threatening trend integrity.
NVDA is coiling between its rising 200-SMA (191.53) and its declining 50-SMA (209.24), sitting 5.87% above the long-term trend line. With RSI at 49.67 and MACD (-2.80) crossing above its signal (-3.29), the tape is at a momentum inflection where the next 50-SMA test defines direction.

Price at 202.78 is trading below the 50-SMA (209.24) but well above the 200-SMA (191.53), preserving the primary uptrend despite near-term consolidation. RSI at 49.67 is neutral, giving room to expand in either direction without overbought risk, while the MACD histogram improvement (-2.80 vs -3.29 signal) hints at waning downside momentum. The 5.87% cushion to the 200-SMA is healthy but not stretched, and a reclaim of the 50-SMA at 209.24 would flip the short-term trend structure bullish. Trade-quality (89.7) and profit-probability (83.0) are strong, though technical-inflection at 46.7 argues for staged entries rather than full-size commitment.
SPY at 751.71 is extending a持续 uptrend above both the 50-SMA (740.37) and 200-SMA (694.04), sitting 8.31% above the long-term mean. The setup is at an inflection because RSI 57 and a positive MACD (2.61 vs 2.01) suggest room to run, yet the trade-quality score (81) contrasts with a low technical-inflection score (38), signaling a mature trend rather than a fresh breakout.

Trend structure is constructive: price > 50-SMA > 200-SMA in classic bull alignment, with the 50-SMA rising toward the tape as dynamic support near 740. MACD remains above signal with a 0.60 spread, indicating momentum is still expanding but not stretched. RSI at 57.12 leaves headroom before the 70 overbought threshold, though the 8.31% extension above the 200-SMA argues any pullback toward 740 would be a healthier re-entry than chasing at highs.
Ranked by technical inflection, profit-probability, and trade quality. Educational only. Not financial advice.