Price sits 3.98% above the 200-SMA and roughly 13% above the 50-SMA, evidencing a clean uptrend with both moving averages stacked bullishly. MACD's decisive positive spread (+4.45 over signal) confirms strong momentum, but an RSI of 71.81 warns that near-term reward-to-risk on fresh longs is compressed. The prior resistance shelf near the 200-SMA at 433.83 now acts as first structural support, with the 50-SMA at 398.46 as the deeper trend line. Trade-quality score of 91 combined with a moderate technical-inflection score of 63.8 argues for patience on entries rather than chasing strength.
Thursday Playbook — Top 5 Setups
The day's five highest-conviction setups, ranked by technical inflection, profit-probability, and trade quality — 5 long, 0 short. Trade your plan and manage risk first. Also screened: $GOOGL, $RH, $AAOI, $AVGO, $W, $RDDT.
Inflection64
Probability78
Quality91
MSFT trades at 451.10, extended above both the 50-SMA (398.46) and 200-SMA (433.83), with MACD (4.41 vs signal -0.04) firmly bullish while RSI at 71.81 pushes into overbought territory — an inflection between trend continuation and mean-reversion.
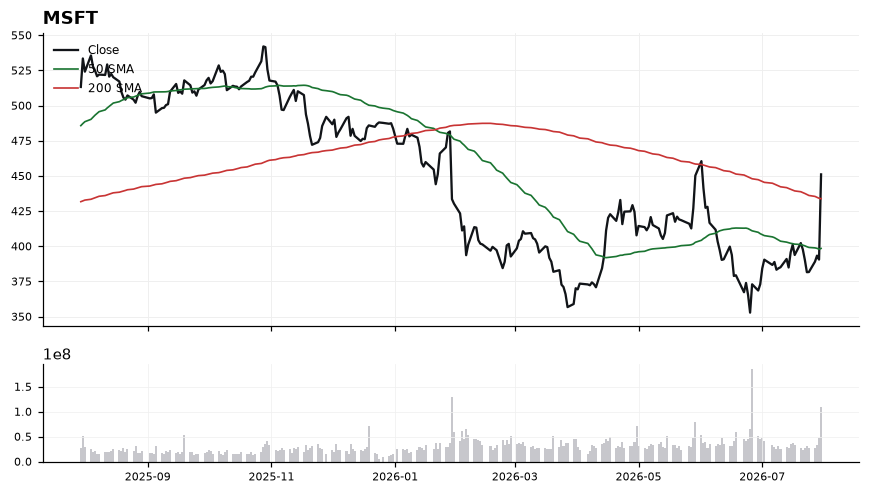
EntryPrefer staggered entries on pullback into 438-442 (retest of prior breakout / just above 200-SMA at 433.83); a momentum add-on trigger is a daily close reclaiming 455 after any shallow dip.
InvalidationDaily close below 433.00 (loss of 200-SMA); this would break the trend-continuation thesis and open risk toward the 50-SMA.
Targets460.00 — measured extension from current consolidation → 475.00 — trend projection off the 50/200-SMA stack
TimeframeSwing (2-6 weeks)
Inflection65
Probability69
Quality93
AMZN is coiling directly on top of its 200-SMA (234.75) while trading 4.4% below its 50-SMA (246.38) — a classic long-side inflection where the working bias is being stress-tested against long-term trend support.
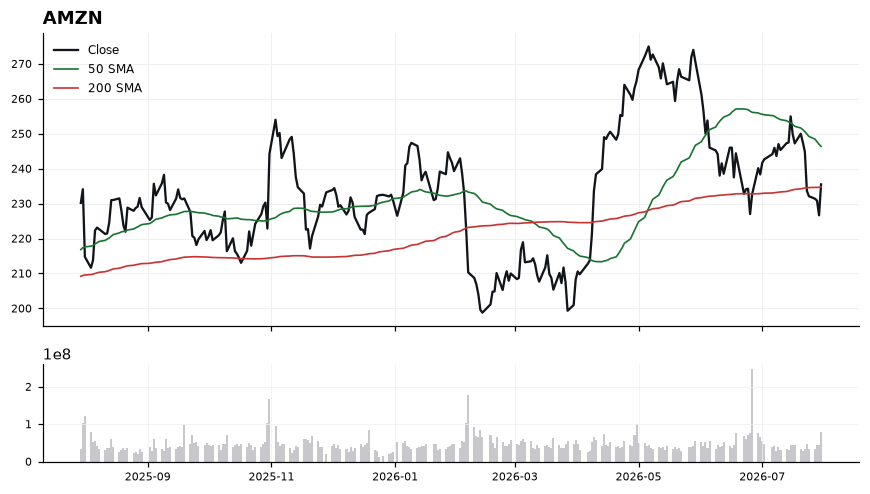
Price at 235.50 sits just 0.32% above the 200-SMA, making that level the line-in-the-sand for the entire uptrend structure. RSI at 44.41 is neutral-to-soft but not oversold, indicating room to absorb further downside without immediate exhaustion, while MACD at -3.63 below its signal of -2.14 confirms momentum has not yet turned. The 50-SMA at 246.38 is now overhead resistance, and the gap between the two SMAs shows a short-term pullback inside a still-intact longer-term trend — consistent with the 64.9 inflection score and 93.4 trade-quality read.
EntryStaged accumulation 234.75–236.50 on a hold of the 200-SMA; confirmation add on a reclaim of 240 with MACD histogram narrowing.
InvalidationDaily close below 230.00. Losing the 200-SMA by more than ~2% invalidates the long-trend thesis and shifts the tape to lower-highs regime.
Targets246.38 — mean-reversion to the 50-SMA → 254.00 — extension through the 50-SMA toward prior swing supply
TimeframeSwing (2-6 weeks)
Inflection63
Probability69
Quality93
NVDA is testing a critical inflection with price at 195.04, sitting just 1.03% above its rising 200-SMA (193.05) while trading below the 50-SMA (206.57) — a classic pullback-to-support setup where the longer-term uptrend is being retested.
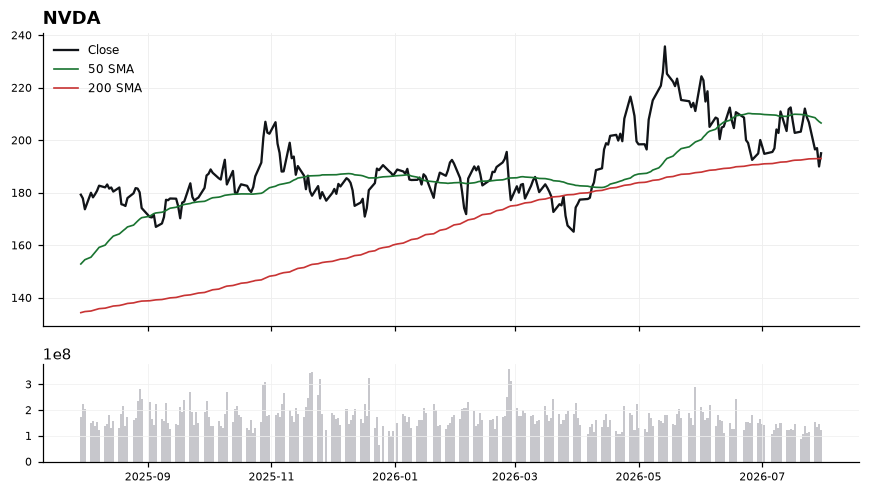
The 200-SMA at 193.05 is acting as the line-in-the-sand support, with the 50-SMA at 206.57 defining overhead resistance and confirming a short-term downtrend within a longer-term uptrend. RSI at 43.08 is neutral-to-soft but not oversold, leaving room for either a bounce or further drift, while MACD at -2.12 below its signal (-0.75) confirms momentum is still negative and has not yet turned. The convergence of price near the 200-SMA with a trade-quality score of 92.9 and technical-inflection score of 63.4 argues this is a decision zone, not a confirmed reversal.
EntryScale-in zone 193.50–195.50 on stabilization above the 200-SMA; add-on trigger on a reclaim of 200.00 with MACD histogram turning up toward the signal line at -0.75.
InvalidationDaily close below 190.50 (roughly 1.3% under the 200-SMA) invalidates the long thesis, signaling loss of the longer-term trend support and opening downside continuation.
TargetsFirst target 206.57 at the 50-SMA (approx. +5.9%), where reactive supply is likely. → Second target 212.00–214.00 on a confirmed 50-SMA reclaim, extending back toward prior range highs.
TimeframeSwing (2-6 weeks)
Inflection71
Probability64
Quality87
GLW is pressing against its 200-day SMA (134.98) with price at 135.22 — a textbook inflection where a multi-month uptrend is being retested for validity. The working long bias reflects proximity to major long-term support (0.18% above) despite near-term momentum weakness.
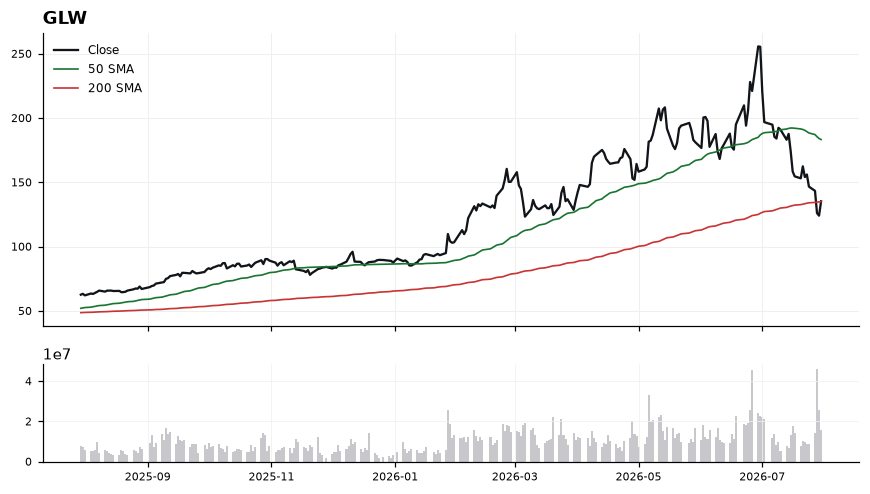
Price sits ~26% below the 50-SMA (183.23), signaling a deep pullback within a broader uptrend, while RSI at 36.45 approaches oversold without confirming it. MACD at -16.44 remains below its signal line (-12.07), indicating momentum is still deteriorating and has yet to inflect. The critical read is the 200-SMA at 134.98: holding it keeps the structural trend intact and sets up a mean-reversion long, while a decisive loss flips the regime. Trade-quality score of 86.5 and inflection score of 71.1 argue the risk/reward is asymmetric here.
EntryStaged accumulation 134.98–136.00 on stabilization; confirmation trigger on a reclaim and hourly close above 137.50 with MACD histogram narrowing.
InvalidationDaily close below 132.00 invalidates the thesis — it would confirm a 200-SMA breakdown, opening the door to a full trend regime change and trapped longs.
TargetsFirst target 150.00 — prior consolidation shelf and mean-reversion checkpoint → Second target 165.00–170.00 — midpoint back toward the 50-SMA at 183.23
TimeframeSwing (2-6 weeks)
Inflection65
Probability69
Quality86
ETOR is coiling just above its 200-day SMA (35.77) while trading below the 50-day (38.84), creating a compression zone where a long-bias inflection can be tested against well-defined structure. With price only 1.04% above the long-term trend and RSI at 40.78, the setup sits at a decision point rather than an extension.
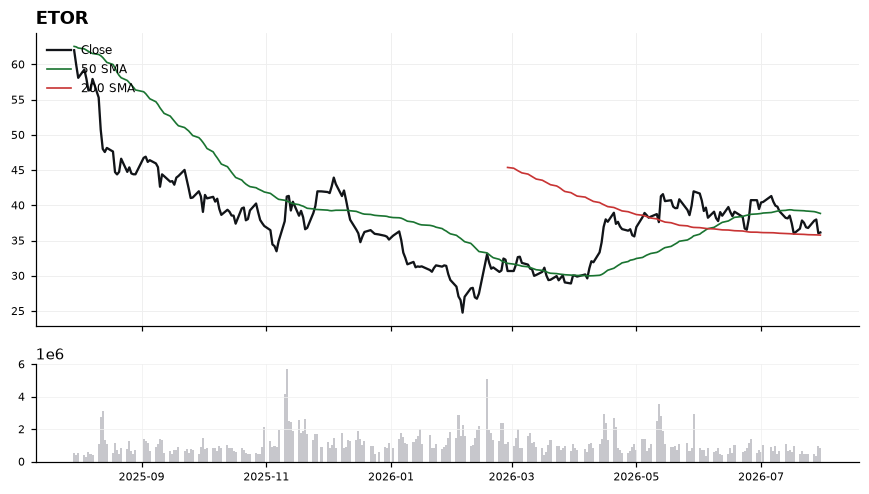
Price at 36.14 is pinned between rising long-term support (200-SMA 35.77) and shorter-term resistance (50-SMA 38.84), a classic mean-reversion window. Momentum is still soft: MACD at -0.64 remains below its signal at -0.48, and RSI at 40.78 sits in the lower-neutral band, indicating downside pressure has eased but not reversed. The 1.04% cushion to the 200-SMA is thin, so any confirmation needs to come from MACD curling toward its signal and RSI reclaiming the 45-50 zone. Trade-quality (85.9) and profit-probability (69.0) scores support a constructive stance, but the technical-inflection score of 65 argues for staged, not aggressive, engagement.
EntryStage entries in the 35.90-36.30 zone on a hold of the 200-SMA (35.77), with an add-on trigger on a reclaim of 37.20 confirmed by MACD crossing above signal.
InvalidationClosing break below 35.20 (roughly 1.5% under the 200-SMA) invalidates the reclaim thesis and signals loss of long-term trend support, forcing exit.
TargetsFirst target 38.80 at the 50-SMA resistance → Second target 40.50 on a 50-SMA reclaim and momentum expansion
TimeframeSwing (2-6 weeks)
Ranked by technical inflection, profit-probability, and trade quality. Educational only. Not financial advice.