Wednesday Playbook — Top 5 Setups

The day's five highest-conviction setups, ranked by technical inflection, profit-probability, and trade quality — 5 long, 0 short. Trade your plan and manage risk first. Also screened: $W, $RDDT, $AVGO, $COST, $CAVA, $ETOR.

1$AMZNMAG7LongMedium convictionscore 72
Inflection52
Probability83
Quality91

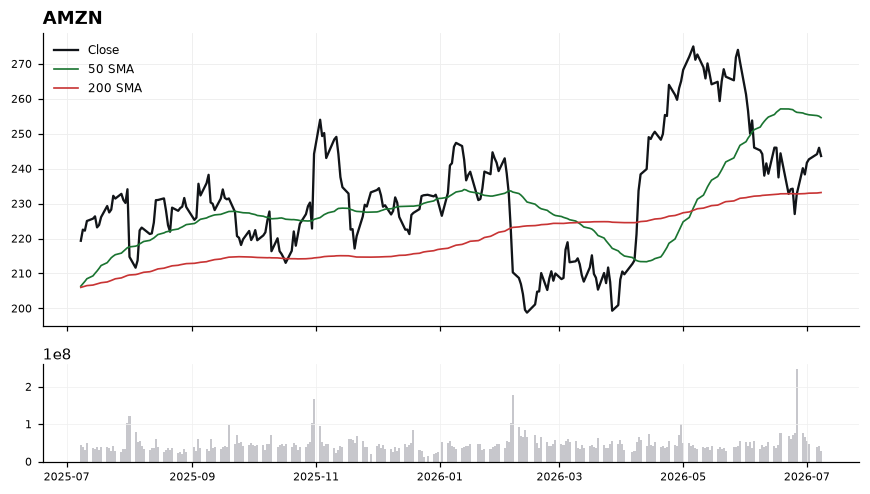
AMZN sits between its rising 200-SMA (233.17) and declining 50-SMA (254.60), coiling 4.48% above long-term trend support after a pullback — a classic mean-reversion inflection within a broader MAG7 uptrend bias.

AMZN chart with 50 and 200 day moving averages

Price at 243.62 is holding above the 200-SMA (233.17) but capped by the 50-SMA (254.60), framing an ~11-point compression range. RSI(14) at 49.41 is neutral, leaving directional room without overbought risk. MACD at -2.53 above its signal at -4.17 shows a bullish momentum crossover forming from below zero — an early trend-repair signal that still requires confirmation. The 200-SMA slope remains constructive, keeping the working long bias intact so long as 233.17 holds.

EntryConstructive accumulation zone 240–244 on stabilization; add-on trigger on a reclaim and hourly close above the 50-SMA at 254.60.
InvalidationSwing invalidation on a daily close below 232.00 (loss of the 200-SMA at 233.17), which would negate the MACD repair and shift structure back to distribution.
TargetsFirst target 258–262, retest of the declining 50-SMA and prior supply → Second target 270–274 on a confirmed 50-SMA reclaim and MACD cross above zero
TimeframeSwing (2-6 weeks)
2$SPYTradedLongMedium convictionscore 70
Inflection38
Probability98
Quality82

SPY at 745.40 is grinding higher above both key moving averages (50-SMA 739.64, 200-SMA 693.60), but with RSI at 52.92 and a modest MACD spread (2.16 vs 1.86), the tape sits at an inflection where continuation must be confirmed by holding the 50-SMA on any pullback.

SPY chart with 50 and 200 day moving averages

Price trades ~0.8% above the rising 50-SMA and 7.47% above the 200-SMA, confirming an intact intermediate uptrend with no immediate mean-reversion pressure. RSI at 52.92 is neutral-constructive, leaving room to run before overbought conditions engage. MACD remains above its signal line (2.16 vs 1.86), a positive but narrow spread that suggests momentum is present yet not accelerating. The combination argues for a working long bias while acknowledging that a break of 739.64 would neutralize the setup.

EntryPreferred add zone 739.64–742.00 on pullbacks to the 50-SMA; momentum trigger on a reclaim/hold above 745.40 with MACD spread expanding.
InvalidationDaily close below 735.00 (below 50-SMA); breaking this level signals loss of the short-term trend structure and shifts risk toward the 693.60 200-SMA over time.
TargetsFirst target 755.00 as measured continuation of the current leg above the 50-SMA → Second target 765.00 on sustained MACD expansion and RSI push above 60
TimeframeSwing (2-6 weeks)
3$ALGNTradedLongMedium convictionscore 70
Inflection37
Probability98
Quality82

ALGN is grinding higher above both moving averages with a Long working bias, sitting at 174.68 just above the 50-SMA (171.58) and 7.32% over the rising 200-SMA (162.77). The inflection sits in the fact that momentum is neutral (RSI 49.25) even as MACD (2.66 vs signal 2.13) remains in a positive cross — a coiled setup awaiting confirmation.

ALGN chart with 50 and 200 day moving averages

Structurally constructive: price > 50-SMA > 200-SMA defines an intact uptrend, and the ~3.11 point cushion over the 50-SMA is the first line of defense. MACD above signal argues trend momentum is still with buyers, but RSI at 49.25 shows no thrust — the tape is consolidating rather than trending. Trade-quality (81.8) and profit-probability (98.0) are strong, while technical-inflection at 36.9 warns that a clean breakout signal has not yet fired. Watch behavior around 171.58 (50-SMA) on the downside and prior local highs on the upside for the next directional cue.

EntryPreferred entry on a pullback to 171.50–172.50 (50-SMA retest) that holds, or a momentum add on a decisive close above 178.00 with RSI pushing back over 55.
InvalidationClose below 168.00 invalidates the long thesis — it would break the 50-SMA shelf, likely flip MACD toward a bearish cross, and open a drift toward the 200-SMA near 162.77.
TargetsFirst target 182.50 — reclaim of recent range highs and MACD expansion zone → Second target 189.00 — trend-extension objective while price holds above the 50-SMA
TimeframeSwing (2-6 weeks)
4$NVDAMAG7LongMedium convictionscore 69
Inflection45
Probability83
Quality89

NVDA is coiling between its rising 200-SMA (191.40) and a downward-sloping 50-SMA (209.52) at 204.12, with trade-quality (89.2) and profit-probability (83.0) both elite while technical-inflection (44.5) flags an unresolved pivot. The setup sits at an inflection because price is neutral (RSI 50.98) yet MACD (-3.30 vs signal -3.41) has just curled above its signal line, hinting momentum may be turning back up.

NVDA chart with 50 and 200 day moving averages

Price at 204.12 sits 2.6% below the 50-SMA (209.52) but a healthy 6.64% above the 200-SMA (191.40), preserving the longer-term uptrend structure. RSI at 50.98 is textbook neutral, offering room to expand in either direction without being overbought. The MACD histogram has flipped positive (-3.30 over -3.41), an early bullish momentum cue, though both lines remain below zero — signaling a recovery attempt, not a confirmed trend change. The key battleground is the 50-SMA at 209.52; reclaiming it would validate the long bias implied by the quality scores.

EntryTiered accumulation: initial tranche 202.00–204.50 on stabilization; add on a confirmed reclaim of the 50-SMA at 209.52 with momentum follow-through.
InvalidationDaily close below 197.50. Breaking that zone would put price on a fast track toward the 200-SMA at 191.40 and invalidate the momentum turn suggested by the MACD cross.
TargetsFirst target: 209.52 (50-SMA reclaim); extension to 214.00 on breakout → Second target: 220.00–222.00, reopening prior swing highs
TimeframeSwing (2-6 weeks)
5$HPQTradedLongMedium convictionscore 69
Inflection47
Probability84
Quality83

HPQ trades at 23.78, above both the 50-SMA (23.10) and 200-SMA (22.61), keeping the working long bias intact, but a bearish MACD cross (-0.26 vs signal -0.17) flags near-term momentum stall at an inflection point.

HPQ chart with 50 and 200 day moving averages

Price sits 5.16% above the rising 200-SMA and roughly 2.9% above the 50-SMA, confirming a constructive intermediate trend structure. RSI(14) at 53.78 is neutral-to-mildly positive, leaving room in either direction without overbought risk. However, MACD below its signal line and in negative territory signals fading upside momentum, so a shallow pullback toward the 50-SMA is the higher-probability path before continuation. Trade-quality (83.2) and profit-probability (84.0) scores support the long thesis, while the modest technical-inflection score (46.7) argues for patience on entry.

EntryPreferred long entry on a pullback into the 23.10-23.30 zone (50-SMA retest), or on a momentum trigger via a reclaim and hourly close back above 23.90.
InvalidationInvalidation on a close below 22.60, which would breach the 200-SMA and negate the uptrend structure, forcing a bias reset.
TargetsFirst target 24.60, prior swing resistance and a ~3.5% extension from spot → Second target 25.40, measured move projecting off the 200-SMA base
TimeframeSwing (2-6 weeks)

Ranked by technical inflection, profit-probability, and trade quality. Educational only. Not financial advice.