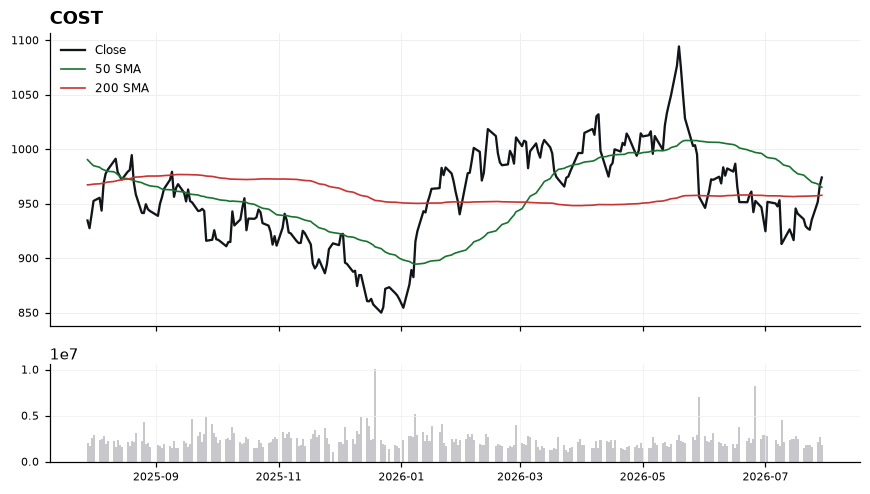
The 50-SMA at 965.12 sits above the 200-SMA at 957.68, a classic bullish alignment, and price is holding above both. RSI(14) at 60.28 confirms momentum without yet reaching overbought territory, leaving room to extend. MACD at -1.42 remains below zero but has crossed sharply above its signal at -7.93, an early momentum reversal that pairs with the technical-inflection score of 68.4. The tight 1.71% cushion to the 200-SMA means the trend is intact but not stretched.
Wednesday Playbook — Top 5 Setups
The day's five highest-conviction setups, ranked by technical inflection, profit-probability, and trade quality — 5 long, 0 short. Trade your plan and manage risk first. Also screened: $QQQ, $IGV, $NVDA, $GOOGL, $W, $TQQQ.
Inflection68
Probability98
Quality80
COST is trading at 974.03, extended just 1.71% above its 200-SMA (957.68) and now clearing the 50-SMA (965.12), setting up a shallow trend-continuation inflection with both moving averages stacked bullishly beneath price.
EntryPrefer accumulation on pullbacks into the 965–968 zone (50-SMA retest); alternatively, trigger on a confirmed close back above 975 if momentum extends directly.
InvalidationInvalidation on a decisive close below 957.68 (200-SMA); breaking that level would negate the bullish MA stack and flip the working bias to neutral.
TargetsFirst target 992–995, a ~2% extension aligned with prior swing resistance → Second target 1,010, capturing continuation on sustained RSI above 60
TimeframeSwing (2-6 weeks)
Inflection67
Probability69
Quality86
ETOR is coiling just above its rising 200-SMA at 35.78 while trading below the 50-SMA at 38.93, setting up a classic long-bias inflection where the longer-term trend support is being retested. With price only 0.70% above the 200-day, the tape is at a decision point that typically resolves sharply.
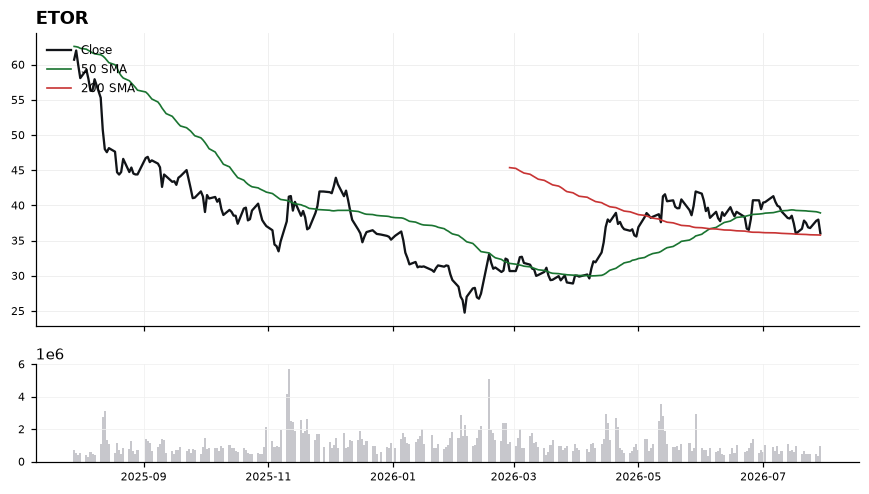
Price at 36.03 sits sandwiched between overhead resistance at the 50-SMA (38.93) and immediate support at the 200-SMA (35.78), a 3.15-point compression zone. RSI at 40.15 is subdued but not oversold, leaving room to rebuild upside momentum, while MACD at -0.58 versus signal -0.43 confirms downside momentum is still active but flattening. The trade-quality score of 86.1 and profit-probability of 69.0 argue that risk/reward improves materially if the 200-SMA holds on this retest.
EntryAccumulation zone 35.80–36.20 on a hold of the 200-SMA, with confirmation add-on above 37.00 if MACD crosses back above its signal line
InvalidationBelow 35.20 on a daily close; losing the 200-SMA cleanly would invalidate the long thesis and open a trend-change scenario
TargetsFirst target 38.90 at the 50-SMA resistance → Second target 40.50 on a 50-SMA reclaim and momentum extension
TimeframeSwing (2-6 weeks)
Inflection62
Probability69
Quality90
AVGO is testing the 200-SMA (365.47) from above after pulling back roughly 6.6% from the 50-SMA at 396.40, putting price at a decision point where the long-term trend either reasserts or gives way. With price just 1.33% above the 200-day and RSI at 43.34, the setup is coiled near a well-defined support zone.
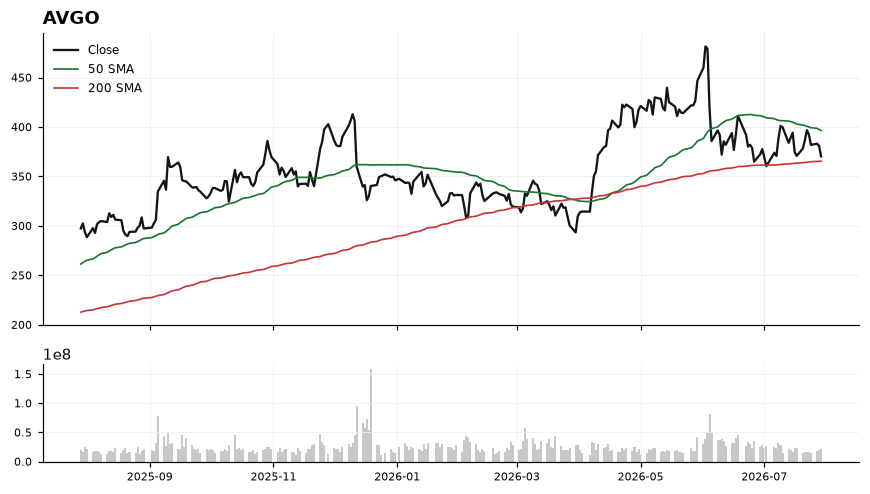
Price at 370.32 sits below the 50-SMA (396.40) but above the rising 200-SMA (365.47), classic mid-trend consolidation. RSI(14) at 43.34 shows fading momentum but is not yet oversold, leaving room for either a bounce or a flush. MACD at -3.01 versus signal -2.91 remains negative with the line still below signal, so momentum has not confirmed a turn. The narrow 1.33% cushion to the 200-SMA makes this a binary structural test — hold and reclaim, or lose the trend line.
EntryTiered accumulation: initial 368-372 zone at current price with 200-SMA support underneath; add on a reclaim trigger above 378 confirming a MACD cross toward the signal line.
InvalidationDaily close below 362 (roughly 1% under the 200-SMA at 365.47) invalidates the long thesis, signaling loss of the long-term uptrend and opening downside continuation.
TargetsFirst target 388-396, the underside of the 50-SMA at 396.40 → Second target 408-412, a reclaim and extension above the 50-SMA
TimeframeSwing (2-6 weeks)
Inflection70
Probability64
Quality80
LITE is testing its 200-SMA at 595.67 with price at 602.35, just 1.12% above this major long-term reference — a classic inflection where a Long bias can be defined against a tight invalidation.
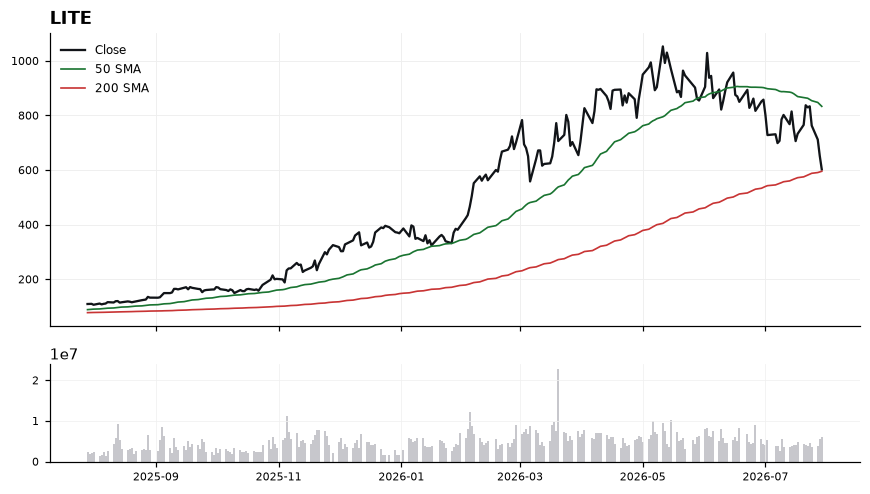
Price is deeply extended below the 50-SMA at 833.51, confirming a downtrend, but RSI(14) at 34.18 signals near-oversold conditions where selling pressure typically wanes. MACD at -38.76 vs signal -27.22 remains negative and below signal, so momentum has not yet turned — the setup is a mean-reversion attempt into a well-defined support, not a trend reversal. The 200-SMA at 595.67 is the pivot: holding it keeps the long thesis alive; losing it opens downside continuation given the negative MACD posture.
EntryStagger entries in the 598-605 zone on stabilization above the 200-SMA (595.67); a confirmation trigger is a reclaim and hold above 610 with MACD histogram narrowing.
InvalidationDaily close below 588 invalidates the setup — this breaks the 200-SMA support by a meaningful margin and confirms the negative MACD cross is extending, opening risk of a deeper trend leg.
TargetsFirst target 675-690 (mean-reversion toward the mid-gap between price and the 50-SMA) → Second target 780-835 (retest of the 50-SMA at 833.51)
TimeframeSwing (2-6 weeks)
Inflection65
Probability64
Quality85
AKAM is testing its 200-day SMA at 104.71 from above with price at 107.41, creating a classic long-side inflection where a well-defined trend support meets deeply oversold momentum. With RSI at 33.05 and a working long bias, the setup is about defending the 200-day rather than chasing strength.
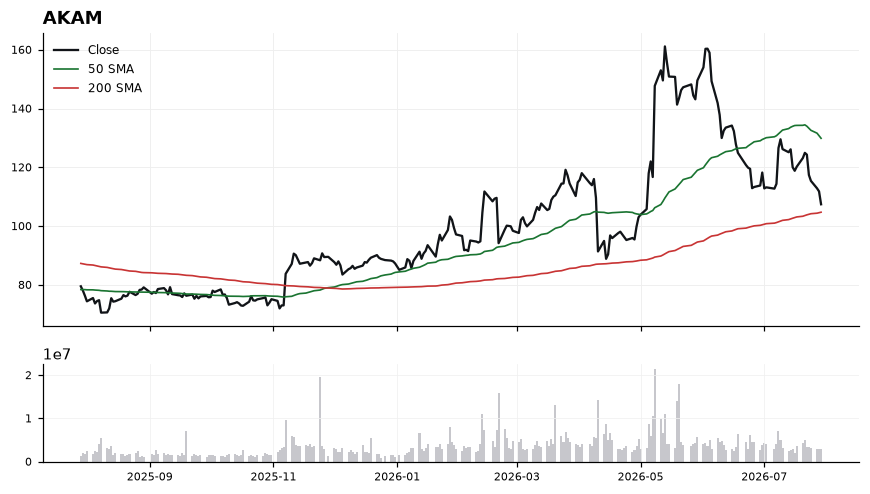
Price sits just 2.58% above the 200-SMA (104.71) but a wide 17.3% below the 50-SMA (129.87), confirming a pullback within a broader uptrend structure. RSI(14) at 33.05 is near oversold, historically a zone where mean-reversion attempts emerge. MACD at -3.67 vs signal -2.71 remains negative and below signal, so downside momentum has not yet inflected — any long is anticipatory of a turn, not a confirmed one. The 200-SMA is the pivotal line: holding it keeps the long thesis intact; losing it flips the technical regime.
EntryScale into the 105.00–107.50 zone on stabilization near the 200-SMA (104.71); a stronger trigger is a reclaim and hourly close back above 108.50 with MACD histogram narrowing.
InvalidationDaily close below 102.50 (roughly 2% under the 200-SMA). Breaking it invalidates the 200-day support thesis and opens a deeper trend-change scenario back toward the low-90s.
TargetsFirst target 118.00 — mean-reversion toward the midpoint between price and the 50-SMA. → Second target 129.87 — full retest of the 50-SMA where trend resistance is likely to cap.
TimeframeSwing (2-6 weeks)
Ranked by technical inflection, profit-probability, and trade quality. Educational only. Not financial advice.