The 50-SMA at 407.07 has crossed back below price and is curling up toward the 200-SMA, hinting at an early bullish alignment if 418.60 holds as support. MACD at -0.05 versus signal -2.64 shows a decisive positive cross with momentum inflecting from deeply negative, while RSI at 54.70 is constructive but not yet overbought, leaving room to extend. The tape is pressed against the 200-SMA from below-to-through, so acceptance above 418.60 is the tell; rejection would drop price back into the 407–418 pocket.
Tuesday Playbook — Top 5 Setups
The day's five highest-conviction setups, ranked by technical inflection, profit-probability, and trade quality — 5 long, 0 short. Trade your plan and manage risk first. Also screened: $META, $ANET, $GOOGL, $QCOM, $TSM, $AMD.
Inflection69
Probability83
Quality93
TSLA is coiling right on top of its 200-SMA (418.60) with price at 419.77, threading between reclaimed trend support at the 50-SMA (407.07) and the long-term mean — a classic inflection where a 0.28% tag of the 200-day resolves directionally.
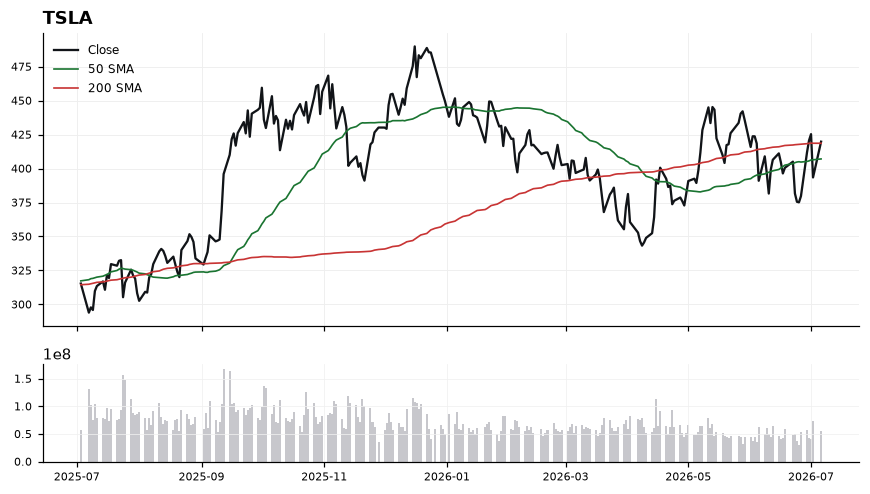
EntryPreferred: pullback entry into 412–415 with the 50-SMA (407.07) as backstop. Alternate: breakout trigger on a daily close above 422.50 confirming acceptance over the 200-SMA (418.60).
InvalidationDaily close below 406.00 (under the 50-SMA at 407.07) invalidates the reclaim thesis and signals momentum has failed to hold above the rising short-term trend.
TargetsFirst target 438.00 — measured extension above the 200-SMA and prior supply shelf. → Second target 452.00 — continuation objective if MACD momentum expands and RSI pushes into the 60s.
TimeframeSwing (2-6 weeks)
Inflection50
Probability83
Quality90
AMZN sits at 244.16, wedged between its rising 200-SMA at 233.03 (+4.77% cushion) and a declining 50-SMA at 255.19, forming a classic mean-reversion inflection. With RSI at a neutral 50.05 and MACD (-3.69) crossing above its signal (-4.98), momentum is quietly turning up from an oversold reset — consistent with the Long working bias but not yet confirmed.
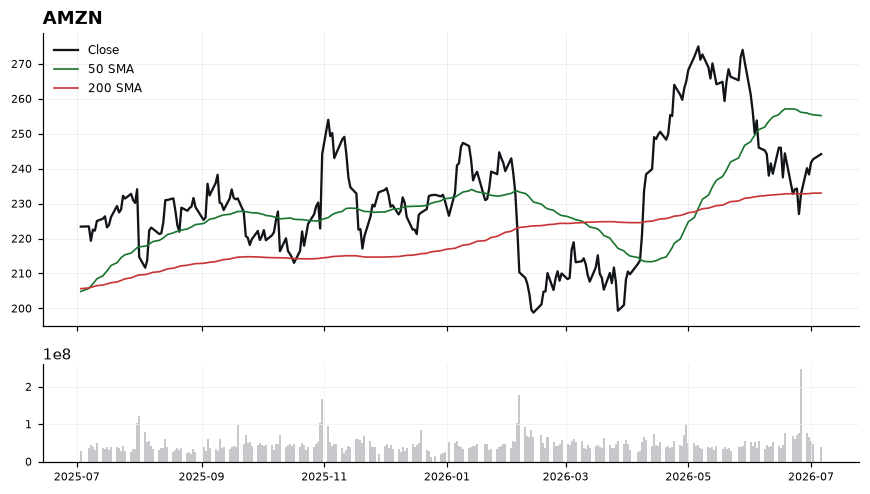
Price is trading ~4.3% below the 50-SMA and ~4.8% above the 200-SMA, a compression zone that typically resolves with expansion. The MACD histogram has flipped positive (-3.69 vs -4.98 signal), signaling waning downside momentum, while RSI at 50.05 indicates a balanced tape with room to run before overbought conditions. The 200-SMA at 233.03 has served as the structural floor, and reclaiming the 50-SMA at 255.19 would flip the intermediate trend. Trade-quality (90.4) and profit-probability (83.0) scores are high, but technical-inflection at 50.3 argues for a trigger-based entry rather than anticipation.
EntryAccumulate on strength above 246.50 with confirmation on a close over 248.00; alternative pullback entry into the 238.00–240.00 shelf above the 200-SMA
InvalidationDaily close below 232.00 — this breaks the 200-SMA (233.03) and invalidates the higher-low structure supporting the long thesis
TargetsFirst target 255.00 at the 50-SMA confluence → Second target 264.00–266.00 on a 50-SMA reclaim and momentum expansion
TimeframeSwing (2-6 weeks)
Inflection60
Probability69
Quality92
NVDA is coiling just above its rising 200-SMA at 191.13 while trading well below its 50-SMA at 209.66, framing a classic mean-reversion inflection where the long-term trend is being retested. With trade-quality scoring 92.1 and profit-probability 69.0, the risk/reward around the 200-day is asymmetric for a tactical long attempt.
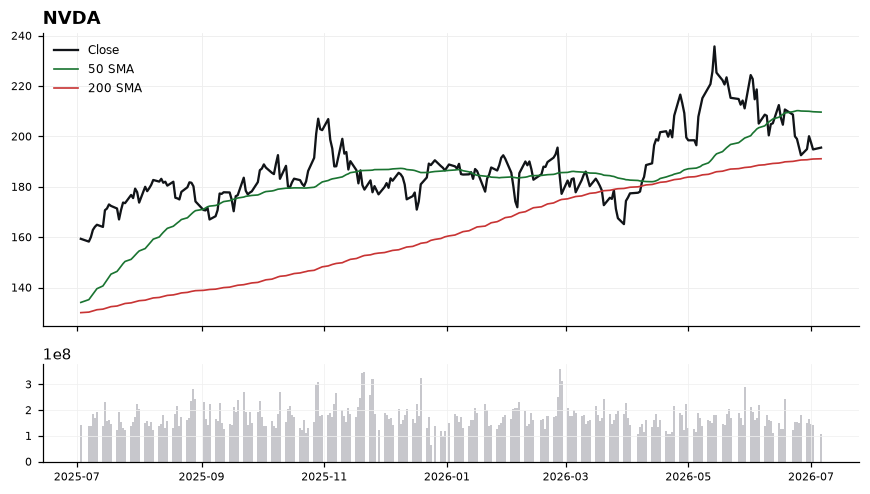
Price at 195.55 sits only 2.31% above the 200-SMA (191.13), a level that has historically acted as a demand shelf in uptrends. RSI at 41.95 signals cooling momentum without confirming oversold, leaving room for either a bounce or a deeper flush. MACD at -4.13 remains below its signal line at -3.30 and has not yet crossed, so momentum confirmation is still pending. The 50-SMA at 209.66 caps upside and defines the gap that a successful reclaim would need to close.
EntryStaggered accumulation zone 192.00-196.00, with a confirmation add-on trigger only on a daily MACD cross back above signal and reclaim of 200.00.
InvalidationDaily close below 188.50 (roughly 1.4% under the 200-SMA); losing the 200-day on a closing basis invalidates the long thesis and opens a trend-change risk toward the prior structure.
TargetsFirst target 209.66 at the 50-SMA, the immediate mean-reversion objective → Second target 218.00-220.00 on a 50-SMA reclaim that restores trend alignment
TimeframeSwing (2-6 weeks)
Inflection54
Probability69
Quality88
AVGO trades at 373.90, wedged between reclaimed 200-SMA support (361.52) below and a lost 50-SMA (408.45) above, defining a classic mean-reversion inflection within the semiconductor complex.
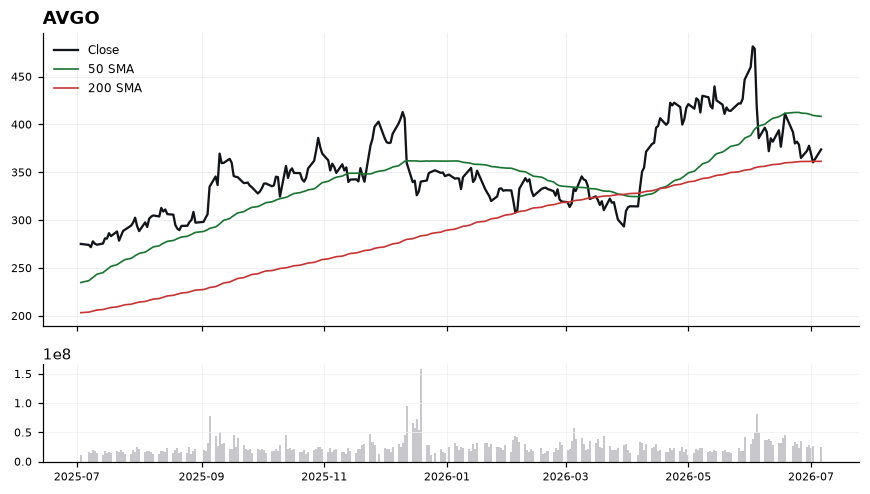
Price sits just 3.42% above the rising 200-SMA, offering a proximate structural floor, while the 50-SMA at 408.45 caps the tape and confirms a short-term downtrend. RSI at 44.72 is neutral-to-soft with room to run before overbought, and MACD at -11.24 remains below its signal (-9.67), indicating momentum has not yet turned. The setup favors patience: buyers need to defend the 200-SMA to keep the higher-timeframe uptrend intact, and a MACD cross would be the first confirmation that downside momentum is exhausting.
EntryStaggered accumulation on tests of 365-370 near the 200-SMA (361.52), or a momentum trigger on a reclaim of 385 with MACD crossing above signal.
InvalidationDaily close below 355 (roughly 1.8% under the 200-SMA) invalidates the long thesis, signaling loss of the primary trend support and opening a deeper reset.
Targets395-408 zone into the 50-SMA at 408.45 → 430+ on a reclaim and hold above the 50-SMA
TimeframeSwing (2-6 weeks)
Inflection21
Probability98
Quality84
AAPL is trading at 312.66, extended 15.35% above its rising 200-SMA (271.06) and 6.2% above the 50-SMA (294.31), with a fresh bullish MACD crossover (0.88 vs -0.58) reinforcing trend continuation. The inflection sits in whether price can sustain above the 310 shelf or mean-revert toward the 50-SMA given RSI at 62.43 approaching the overbought zone.
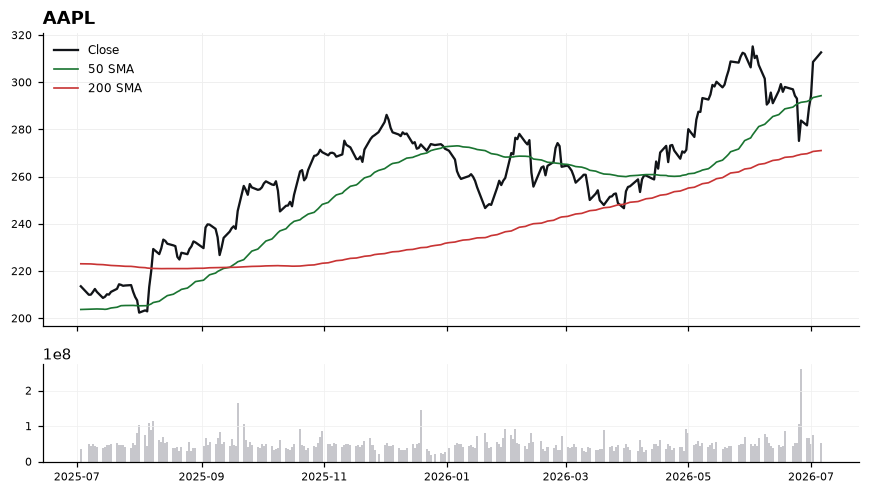
Trend structure is constructive: 50-SMA above 200-SMA with price above both, defining a stacked bullish alignment. MACD flipping positive from below zero signals momentum expansion, while RSI 62.43 confirms strength without yet flashing exhaustion (>70). However, the 15.35% gap to the 200-SMA is stretched, meaning the highest-quality long entries typically come on pullbacks toward the 50-SMA at 294.31 rather than chasing at 312.66. The technical-inflection score of 20.9 argues against fresh breakout aggression; the 98.0 profit-probability and 83.5 trade-quality favor patient adds on weakness.
EntryPreferred add zone 298-303 on a pullback toward the 50-SMA (294.31); secondary trigger on a reclaim and daily close above 315 with MACD histogram expanding.
InvalidationDaily close below 293 (under the 50-SMA). Breaking this invalidates the short-term uptrend, opens a momentum unwind, and would target a deeper retrace toward the mid-280s.
Targets322 — measured extension from the current base and prior resistance shelf → 335 — trend continuation objective as the 200-SMA distance widens
TimeframeSwing (2-6 weeks)
Ranked by technical inflection, profit-probability, and trade quality. Educational only. Not financial advice.