Price sits just 0.22% above the 200-SMA, the key pivot, while the 50-SMA at 111.65 caps upside and confirms a short-term downtrend (50 > price). RSI at 44.53 is neutral-to-soft, leaving room to rally without overbought risk, and the MACD histogram narrowing (-0.23 vs -0.30 signal) suggests selling pressure is fading. The tape is coiled between 200-SMA support and 50-SMA resistance, so resolution off the 100.65 shelf will likely dictate the next directional leg.
Thursday Playbook — Top 5 Setups
The day's five highest-conviction setups, ranked by technical inflection, profit-probability, and trade quality — 5 long, 0 short. Trade your plan and manage risk first. Also screened: $SMCI, $ANET, $TSLA, $GOOGL, $TSM, $QCOM.
Inflection70
Probability83
Quality81
CRWV is pressed against its 200-SMA (100.65) with price at 100.88, a textbook inflection where bulls must defend the long-term trend line or cede control. The setup screens hot (trade-quality 80.5, profit-probability 83.0) as MACD (-0.23 vs signal -0.30) curls higher from below zero, hinting at early momentum stabilization.
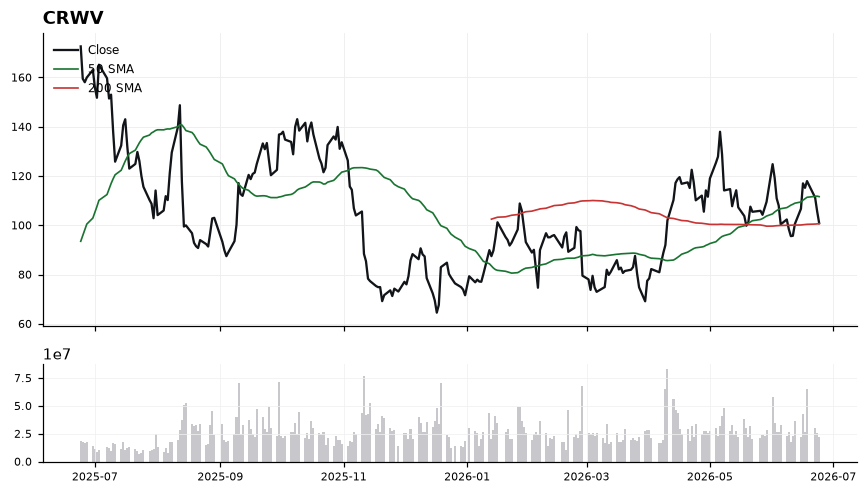
EntryAccumulation zone 100.65–102.00 on a hold of the 200-SMA; momentum trigger on a reclaim and close above 104.00 to confirm the inflection.
InvalidationDaily close below 98.50 invalidates the long thesis — it would mark a decisive loss of the 200-SMA, flipping the long-term trend tag from support to resistance.
TargetsFirst target 111.65 at the 50-SMA, the primary overhead supply zone → Second target 118.00 on a 50-SMA breakout extension
TimeframeSwing (2-6 weeks)
Inflection69
Probability64
Quality93
AMZN is testing its 200-SMA at 232.84 with price at 234.27, just 0.61% above this long-term trend line — a classic inflection where the bull trend either reasserts or breaks down. The working long bias is supported by an oversold RSI of 38 and a trade-quality score of 93.2, suggesting risk/reward is asymmetric here.
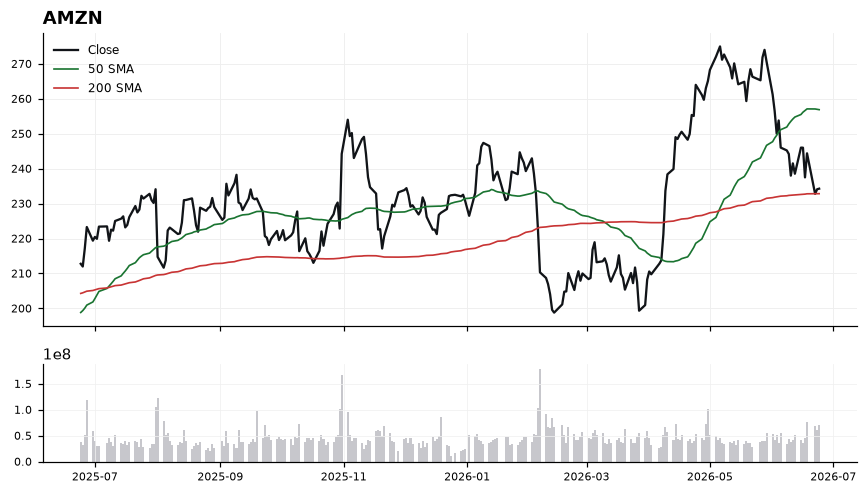
Price has pulled back well below the 50-SMA at 256.89, signaling near-term momentum loss, while the 200-SMA at 232.84 acts as the line in the sand for the broader uptrend. RSI at 38 is approaching oversold without confirming capitulation, and MACD at -6.20 below its signal at -4.69 shows downside momentum still in force but stretched. The convergence of price with the 200-SMA, combined with a 68.5 inflection score, frames a high-quality mean-reversion setup if buyers defend this zone.
EntryAccumulation zone 232.84–235.50 on stabilization, or a confirmed reclaim trigger above 238.00 with MACD histogram narrowing toward the signal line.
InvalidationA decisive close below 228.50 invalidates the setup — it would mark a clean break of the 200-SMA and shift the structural bias from pullback-in-uptrend to trend transition.
TargetsFirst target 248.00 — mean-reversion toward the gap between current price and the 50-SMA → Second target 256.89 — full reversion to the 50-SMA where trend resistance is likely
TimeframeSwing (2-6 weeks)
Inflection52
Probability69
Quality91
NVDA trades at 199.00, wedged between the rising 200-SMA at 190.39 (4.52% cushion) and the 50-SMA resistance at 210.23, with a trade-quality score of 90.6 framing this pullback as a structurally attractive inflection within the MAG7 long bias.
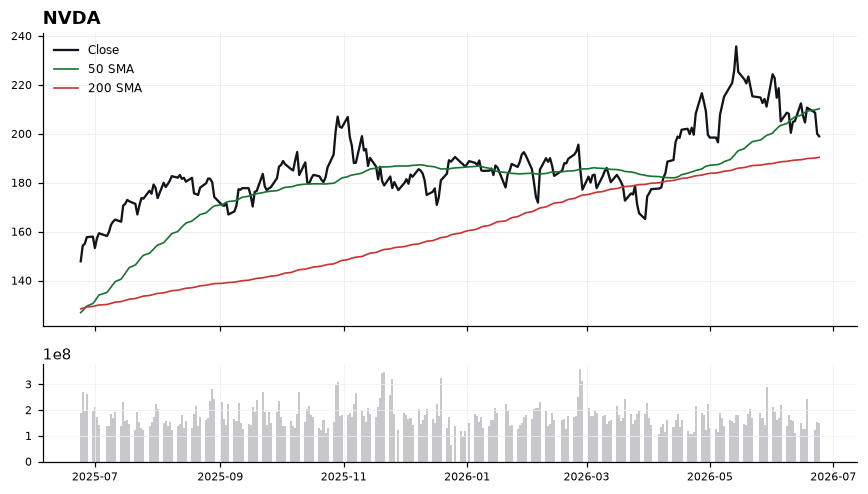
Price sits below the 50-SMA (210.23) but holds above the 200-SMA (190.39), a classic mean-reversion zone where RSI(14) at 41.78 signals weakening momentum without confirming oversold capitulation. MACD at -2.26 versus signal -0.91 shows downside momentum still expanding, so the tape has not yet turned. However, the 200-SMA acting as a rising floor combined with a profit-probability of 69.0 suggests asymmetry favors patient accumulation near the lower band rather than chasing strength.
EntryStagger entries in the 192.00–196.00 zone on stabilization near the 200-SMA (190.39), or alternatively on a reclaim of 205.00 with MACD histogram turning up toward the signal line.
InvalidationDaily close below 188.00; this breaks the 200-SMA support, eliminates the 4.52% cushion, and invalidates the trend-continuation thesis underpinning the long bias.
Targets210.23 (50-SMA reversion and first resistance test) → 218.00 (extension above the 50-SMA on momentum reset)
TimeframeSwing (2-6 weeks)
Inflection39
Probability84
Quality88
AAPL is consolidating just above its rising 50-SMA (290.82) while holding nearly 9% above its 200-SMA (269.03), creating an inflection where a higher-low structure is being tested against deteriorating short-term momentum.
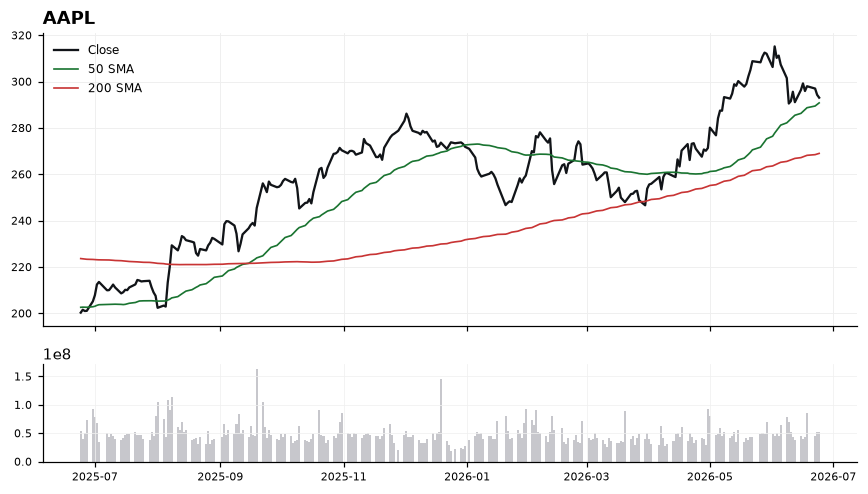
Price at 293.08 sits in a tight band between the 50-SMA support at 290.82 and prior local highs, with the longer-term uptrend intact given the 50-SMA well above the 200-SMA. RSI at 45.81 is neutral-soft, signaling momentum has cooled without breaking down, while MACD at 0.17 below its signal at 1.90 confirms a near-term bearish cross that argues for patience on entries. The 8.94% cushion to the 200-SMA gives room for a pullback without violating the primary trend, so the working long bias is preserved as long as the 50-SMA holds on a closing basis.
EntryStagger longs on a reclaim above 295.00 or on a controlled pullback into the 290.80-289.00 zone where the 50-SMA aligns with prior support.
InvalidationDaily close below 287.50; breaking this would forfeit the 50-SMA and open a path toward the 200-SMA, invalidating the swing-long thesis.
TargetsFirst target 300.00 — round-number resistance and reclaim of pre-pullback range → Second target 308.50 — measured extension toward prior cycle highs
TimeframeSwing (2-6 weeks)
Inflection46
Probability69
Quality87
AVGO is consolidating between its rising 200-SMA (361.01) and falling 50-SMA (412.64), with price at 382.07 sitting in the middle of a compression zone. The working long bias hinges on whether buyers defend the 200-SMA before momentum re-accelerates.
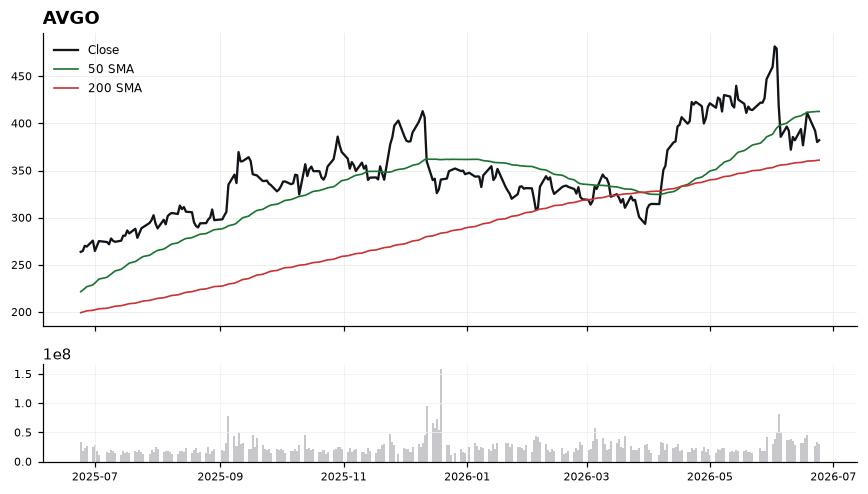
Price trades 5.83% above the 200-SMA, preserving the longer-term uptrend, but it is roughly 7.4% below the 50-SMA, confirming near-term distribution. RSI at 44.08 reflects neutral-to-soft momentum with room to run before either extreme. MACD at -8.08 below its signal at -5.25 shows momentum is still deteriorating, so any long should require evidence of a momentum cross higher rather than chasing strength.
EntryPreferred accumulation zone 365-375 on a successful retest of the 200-SMA at 361.01; alternative trigger is a reclaim and hourly close back above the 50-SMA at 412.64 for trend-continuation buyers.
InvalidationDaily close below 358 (under the 200-SMA at 361.01). Breaking this would invalidate the higher-timeframe uptrend structure and shift bias from constructive pullback to trend break.
Targets412-415 zone, retest of the 50-SMA at 412.64 → Prior swing area near 440, contingent on MACD crossing back above signal
TimeframeSwing (2-6 weeks)
Ranked by technical inflection, profit-probability, and trade quality. Educational only. Not financial advice.