Price at 275.15 trades below the 50-SMA (291.15) but holds above the 200-SMA (269.21), confirming a short-term correction inside an intact longer-term uptrend. MACD at -1.59 versus signal +1.20 shows momentum is still negative and has not yet crossed, so a tactical bottoming signal is pending. RSI 32.2 sits at the lower band where mean-reversion attempts typically emerge, and the 200-SMA acts as the line-in-the-sand support that has not been broken. Trade-quality scores 92.1 with technical-inflection at 67.1, indicating a high-grade setup awaiting confirmation rather than an extended trend entry.
Saturday Playbook — Top 5 Setups
The day's five highest-conviction setups, ranked by technical inflection, profit-probability, and trade quality — 3 long, 2 short. Trade your plan and manage risk first. Also screened: $TSLA, $GOOGL, $MU, $SMCI, $ANET, $QCOM.
Inflection67
Probability64
Quality92
AAPL is sitting just 2.21% above its rising 200-SMA (269.21) while RSI(14) at 32.2 flags an oversold condition, framing a classic pullback-to-trend inflection within the broader MAG7 long bias.
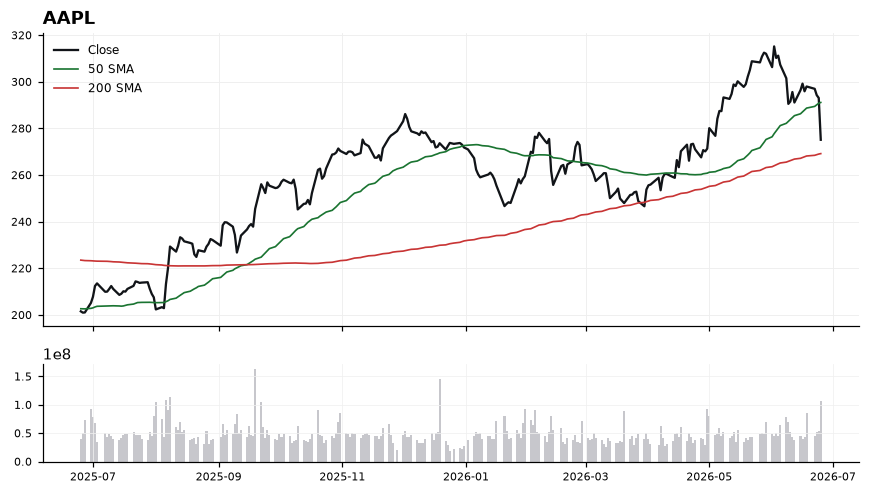
EntryStage entries on a reclaim attempt in the 273-277 zone, with confirmation on a daily close back above 280 and/or a MACD line turn higher toward its signal; a tag of the 200-SMA near 269-270 that holds intraday offers a secondary entry.
InvalidationDaily close below 267 (under the 200-SMA at 269.21); losing this level invalidates the pullback thesis and signals trend transition rather than a buyable dip.
TargetsFirst target 291 at the 50-SMA, where prior support flips to resistance → Second target 300-305 on momentum confirmation via MACD bullish cross
TimeframeSwing (2-6 weeks)
Inflection60
Probability64
Quality92
NVDA is consolidating between its rising 200-SMA (190.53) and declining 50-SMA (210.21), with price at 195.74 sitting just 2.73% above long-term trend support — a classic inflection where the working long bias must be defended at the 200-day or surrendered.
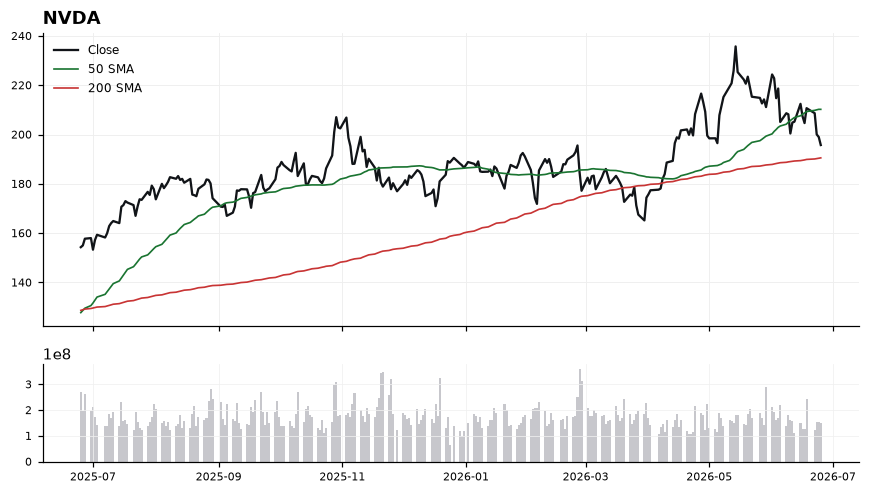
Price trades below the 50-SMA (210.21) but holds above the 200-SMA (190.53), signaling a medium-term pullback inside an intact long-term uptrend. RSI at 39.58 is weak but not yet oversold, leaving room for further drift before mean-reversion. MACD at -2.94 versus signal -1.32 confirms active downside momentum and no bullish cross yet, so dip-buyers need confirmation rather than anticipation. The narrow 2.73% cushion to the 200-SMA defines the line in the sand for the long thesis.
EntryStaged accumulation zone 192.00–196.00 near current price, with a confirmation trigger on a reclaim of 200.00 and MACD crossing back above its signal line.
InvalidationDaily close below 188.50 (under the 200-SMA at 190.53); a break there invalidates the long-term uptrend structure and shifts bias to neutral/short.
Targets210.21 (retest of the 50-SMA and first supply zone) → 218.00–220.00 (extension above the 50-SMA on momentum reset)
TimeframeSwing (2-6 weeks)
Inflection65
Probability56
Quality92
AMZN sits 2.49% below its 200-SMA (232.80) and roughly 11.5% beneath its 50-SMA (256.45), pressing against a key long-term moving average where prior rejections often resolve into trend continuation or reflexive bounces — a textbook inflection for a working short bias.
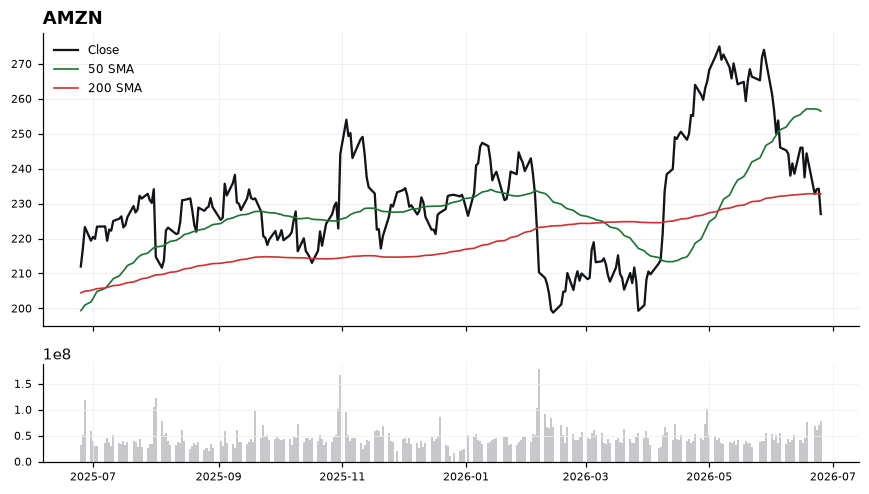
Price at 227.01 has lost the 200-SMA, with the 50-SMA (256.45) sloping above as overhead resistance — a bearish stacking that aligns with the short thesis. RSI(14) at 33.63 is approaching oversold but not yet extended, leaving room for further downside before mean reversion becomes statistically compelling. MACD at -6.87 versus signal -5.13 confirms active downside momentum with the histogram still widening, suggesting sellers retain control. The reclaim battle around 232.80 is the pivotal tell: failure to recapture it keeps the path of least resistance lower.
EntryPreferred short re-entry on a failed retest of the 200-SMA in the 231.50-233.50 zone; alternative momentum trigger on a decisive break below 225.00 with confirmation.
InvalidationInvalidation on a daily close above 237.50 — that would reclaim the 200-SMA with margin, neutralize the MACD slope, and signal the inflection has resolved to the upside.
TargetsFirst target 218.00 — measured continuation of the 50/200-SMA spread compression → Second target 210.50 — extension zone where RSI would likely reach deeper oversold and prior demand may re-emerge
TimeframeSwing (2-6 weeks)
Inflection50
Probability69
Quality87
AVGO is consolidating between its rising 200-SMA (361.17) and a deflated 50-SMA (412.60), with price at 378.91 sitting just 4.91% above long-term trend support — a classic pullback-to-trend inflection within a broader Semiconductor long bias.
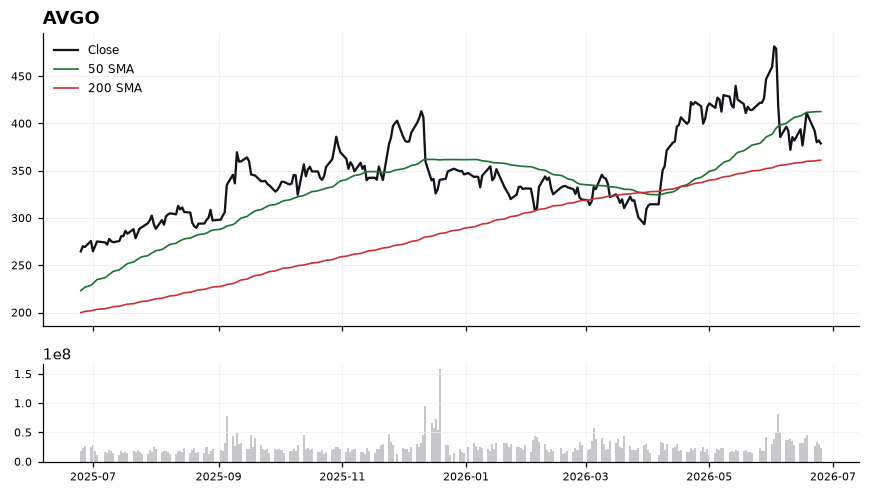
Price trades below the 50-SMA (412.60) but holds above the 200-SMA (361.17), confirming an intact primary uptrend in corrective phase. RSI at 43.27 is neutral-to-soft, leaving room to rebuild without being oversold, while MACD at -8.68 vs signal -5.94 shows momentum still negative but the gap is narrow enough to flag a potential bullish cross if buyers reassert. The 200-SMA at 361.17 is the structural line in the sand; reclaiming the 50-SMA at 412.60 would mark trend repair.
EntryStage entries on a controlled pullback into 365-375 (200-SMA shelf), or alternatively on a momentum trigger above 388-392 confirmed by MACD crossing its signal line.
InvalidationDaily close below 358 invalidates the long thesis — it would breach the 200-SMA, flip the multi-month structure, and signal the corrective phase is extending into a trend change.
TargetsFirst target 412 at the 50-SMA, where mean-reversion sellers typically re-engage → Second target 438-445 on a clean reclaim of the 50-SMA and momentum expansion
TimeframeSwing (3-6 weeks)
Inflection60
Probability61
Quality79
CRWV is pinned just below its 200-SMA (100.68) and well under its 50-SMA (111.28), with momentum rolling over — a classic inflection where a failed reclaim of the 200-day sets up continuation lower.
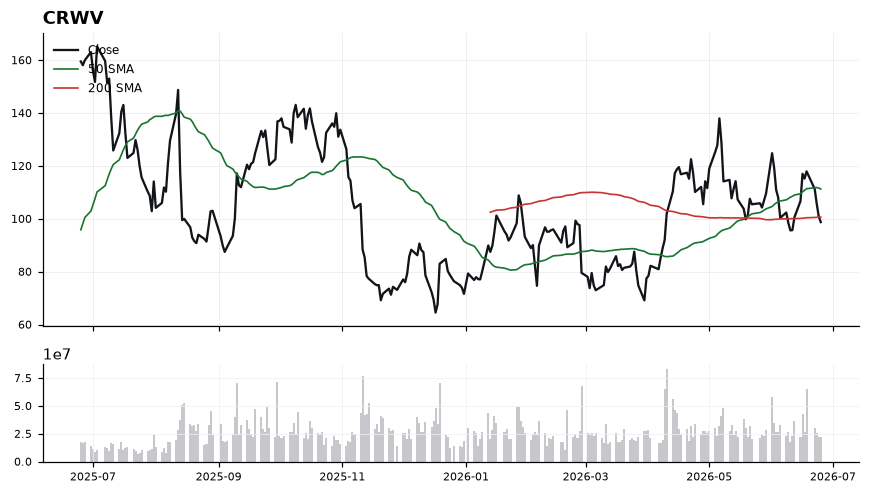
Price at 98.76 sits -1.91% beneath the 200-SMA, framing 100.68 as immediate overhead resistance with the 50-SMA at 111.28 capping any broader bounce. RSI(14) at 43.08 is sub-50 but not oversold, leaving room to work lower, while MACD at -0.91 below its signal at -0.43 confirms negative momentum is still expanding. The configuration favors fading strength into the declining 200-day rather than chasing weakness, with trade-quality scoring at 79.3 reinforcing the setup integrity.
EntryShort zone 100.00–101.50 on a failed retest of the 200-SMA at 100.68; alternative trigger is a clean break and hold below 98.00 on expanding downside momentum.
InvalidationInvalidation on a daily close above 103.00; that would reclaim the 200-SMA decisively and neutralize the bearish MACD/RSI structure, opening a path back toward the 50-SMA.
TargetsFirst target 93.50 (prior demand shelf, ~5% below the 200-SMA) → Second target 89.00 (extension zone if momentum accelerates and RSI pushes toward oversold)
TimeframeSwing (2-6 weeks)
Ranked by technical inflection, profit-probability, and trade quality. Educational only. Not financial advice.