The 1.58% cushion over the 200-SMA marks a fresh reclaim that needs to hold to validate the shift. RSI at 58.23 signals building momentum without overbought stress, leaving room to extend. MACD at -0.95 versus signal -3.70 shows a decisive bullish crossover with the histogram expanding out of negative territory, confirming momentum has turned. The stack (price > 200-SMA > 50-SMA) is constructive, but the bearish 50/200 alignment argues for disciplined risk until the 50-SMA curls up.
Thursday Playbook — Top 5 Setups
The day's five highest-conviction setups, ranked by technical inflection, profit-probability, and trade quality — 5 long, 0 short. Trade your plan and manage risk first. Also screened: $QCOM, $META, $TSM, $ANET, $ALAB, $DELL.
Inflection67
Probability83
Quality93
TSLA is trading at 425.30, holding above both its 50-SMA (406.28) and reclaimed 200-SMA (418.69), with the 50 still below the 200 — a classic bullish inflection where price leads a potential trend structure repair.
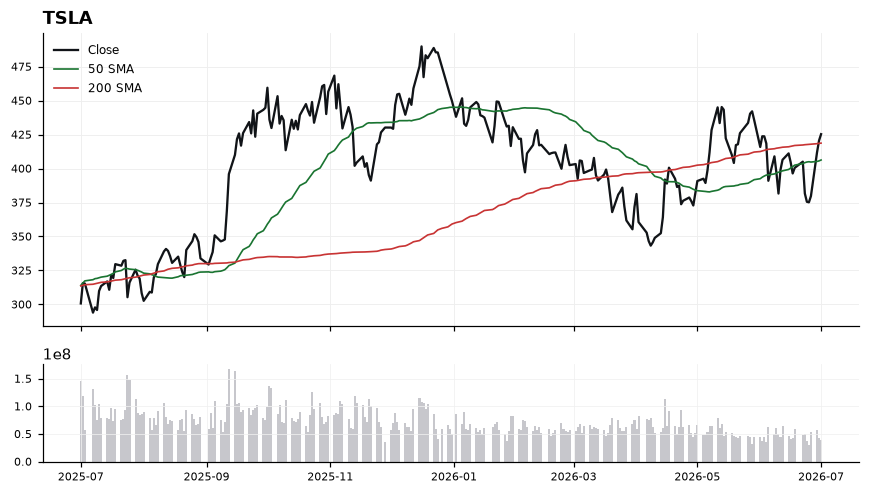
EntryPreferred accumulation on pullbacks into 418.69–421.00 (200-SMA retest); breakout add-on above 428.00 on momentum continuation.
InvalidationDaily close below 406.28 (50-SMA) invalidates the reclaim thesis and signals the MACD cross is failing — exit longs.
Targets440.00 as first measured extension from the 200-SMA reclaim → 455.00–460.00 on continuation as the 50-SMA turns higher
TimeframeSwing (2-6 weeks)
Inflection55
Probability83
Quality91
AMZN is coiling between a rising 200-SMA (232.93) support and a declining 50-SMA (255.56) resistance, sitting 3.77% above long-term trend with a working long bias. The setup is at an inflection as MACD (-5.06 vs signal -5.53) has curled up through its signal line while RSI (47.85) reclaims the midline, hinting at momentum stabilization after a pullback.
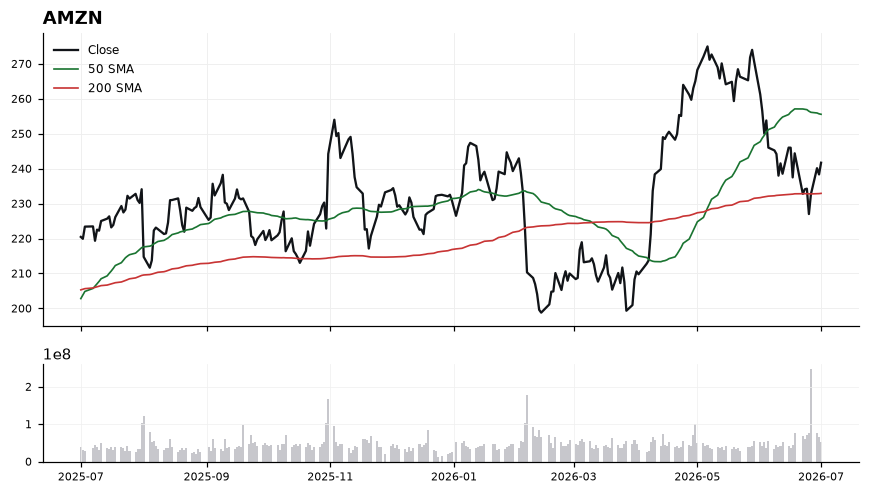
Price at 241.70 trades below the 50-SMA (255.56) but comfortably above the rising 200-SMA (232.93), keeping the primary uptrend intact despite short-term weakness. RSI at 47.85 is neutral but improving, and the MACD histogram narrowing (-5.06 vs -5.53 signal) is an early bullish crossover cue rather than confirmation. The 3.77% cushion to the 200-SMA is thin enough to demand tight risk control, while the 50-SMA overhead defines the ceiling that must break to validate trend resumption. Technical-inflection score of 55.4 alongside a high trade-quality read (91.1) frames this as an asymmetric setup, not a chase.
EntryAccumulation zone 238.00-242.50 with confirmation trigger on a reclaim of 245.00 on expanding momentum; avoid adding until MACD crosses above signal.
InvalidationDaily close below 232.50 (just under the 200-SMA at 232.93) invalidates the long thesis, signaling loss of the multi-quarter trend structure and a likely regime shift.
TargetsFirst target 255.50 at the 50-SMA — the immediate mean-reversion objective and primary resistance → Second target 268.00 on a confirmed 50-SMA reclaim, reopening the prior structural highs
TimeframeSwing (2-6 weeks)
Inflection60
Probability69
Quality89
AVGO trades at 369.34, wedged between reclaimed 200-SMA support at 361.47 and a distant 50-SMA ceiling at 410.26. With RSI at 42 and MACD (-10.83) still below signal (-8.67), the tape is coiled just 2.18% above its long-term trend — a classic inflection where either the 200-day holds and reasserts the uptrend, or it fails and the structure breaks.
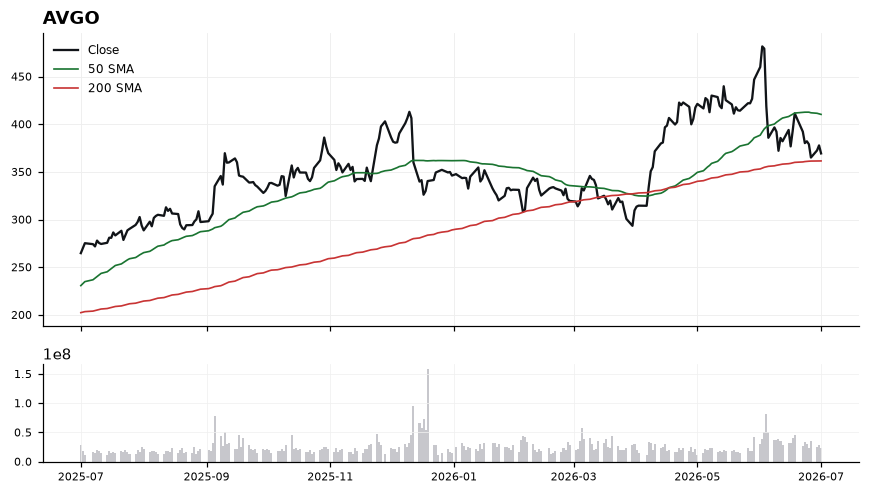
Price sits below the 50-SMA (410.26) but above the rising 200-SMA (361.47), defining a clear pullback-within-uptrend structure. RSI at 42 is soft but not oversold, leaving room to absorb further weakness without a washout signal. MACD remains negative and below its signal line, so momentum has yet to confirm a turn — the crossover is the key trigger to watch. The 2.18% cushion to the 200-SMA is thin, making 361.47 the pivotal line separating continuation from trend damage.
EntryStaged long: initial tranche 365-370 near current price with confirmation of a MACD cross above signal; add on a reclaim of 385 with RSI pushing back above 50.
InvalidationDaily close below 358 (roughly 1% under the 200-SMA at 361.47). A break there invalidates the long-term uptrend support and shifts bias to neutral/defensive.
TargetsFirst target 395-400, the mid-gap between price and the 50-SMA where prior supply likely sits → Second target 410-415, retest of the 50-SMA at 410.26 where trend-followers reassess
TimeframeSwing (2-6 weeks)
Inflection55
Probability69
Quality91
NVDA is consolidating between its rising 200-SMA (190.94) and declining 50-SMA (209.90), sitting just 3.48% above long-term trend support — a classic inflection where the working long bias must be defended or abandoned.
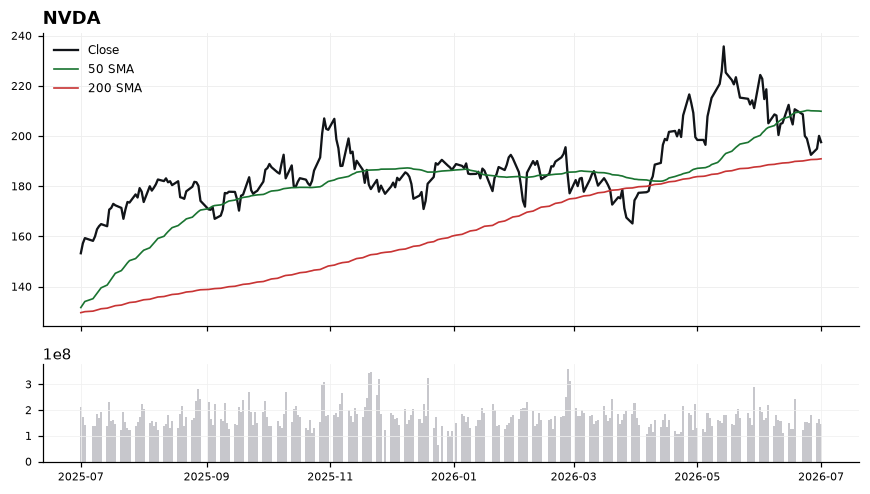
Price at 197.58 has slipped below the 50-SMA (209.90) but holds above the 200-SMA (190.94), keeping the primary uptrend intact while momentum cools. RSI at 43.26 is neutral-to-soft, showing sellers in control but not yet oversold, and MACD at -3.90 below its signal at -2.84 confirms momentum has not yet turned. Trade-quality scores 91.3 and profit-probability 69.0 argue the reward setup is attractive, but technical-inflection at 54.7 signals we need confirmation before committing.
EntryStage entries on either (a) a reclaim of 200.00 with MACD histogram narrowing, or (b) a controlled pullback into 191.00-193.50 that holds the 200-SMA (190.94).
InvalidationDaily close below 188.50 invalidates the thesis — it would break the 200-SMA and flip the multi-quarter trend structure from support to resistance.
TargetsFirst target 209.90 at the 50-SMA, where prior supply likely re-emerges → Second target 218.00-220.00 on a 50-SMA reclaim and MACD bullish cross
TimeframeSwing (2-6 weeks)
Inflection32
Probability84
Quality88
AAPL is coiling just above its 50-SMA (292.67) with a working long bias intact, but momentum has softened — placing the tape at a decision point where either a reclaim reasserts trend or a slip opens a retest lower.
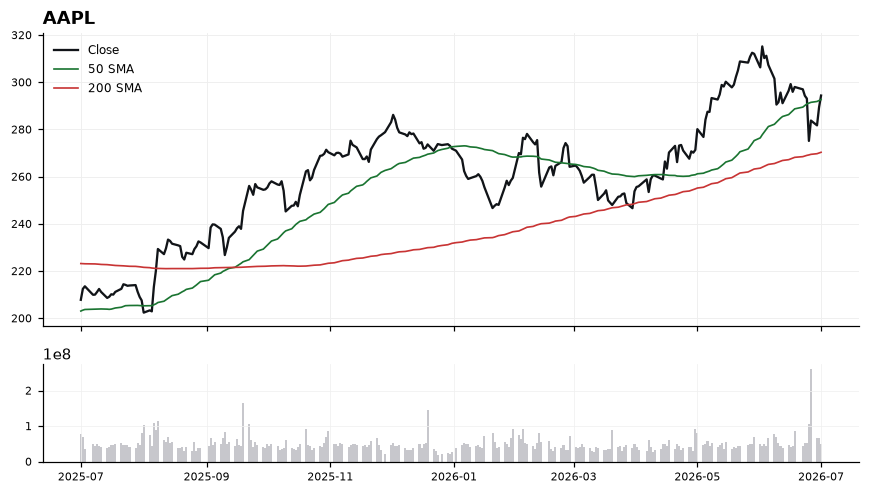
Price at 294.38 sits fractionally above the rising 50-SMA (292.67) and a healthy 8.90% above the 200-SMA (270.33), confirming the broader uptrend structure. RSI(14) at 50.97 is neutral, offering no directional edge, while MACD at -2.26 vs signal -1.01 shows a bearish crossover and negative histogram — a short-term drag against the longer-term trend. The confluence of price hugging the 50-SMA with weakening MACD explains the low technical-inflection score (31.6), even as trade-quality (87.7) and profit-probability (84.0) remain elevated on trend alignment.
EntryPreferred accumulation zone 292.67–294.50 on stabilization above the 50-SMA; alternatively, a momentum trigger on a reclaim above 297.00 with MACD histogram turning up.
InvalidationDaily close below 288.00 invalidates the setup — it would break the 50-SMA support, confirm the MACD bearish cross, and open a gravitational pull toward the 200-SMA near 270.33.
TargetsFirst target 305.00 (recent range highs / momentum extension) → Second target 315.00 (measured trend continuation)
TimeframeSwing (2-6 weeks)
Ranked by technical inflection, profit-probability, and trade quality. Educational only. Not financial advice.