Price has lost the 50-SMA (210.02) and is pressing the 200-SMA (190.73), with RSI(14) at 40.08 reflecting weak but not yet oversold momentum. MACD at -4.05 below its signal at -2.25 confirms bearish momentum has not bottomed, yet the spread is consistent with a late-stage flush rather than fresh breakdown. The trade-quality score (92.1) and profit-probability (69.0) lean constructive, but the 50/200 spread shows trend conflict — bulls must defend 190.73 to keep the long bias intact. A reclaim of 210.02 would be needed to neutralize the momentum drag.
Tuesday Playbook — Top 5 Setups
The day's five highest-conviction setups, ranked by technical inflection, profit-probability, and trade quality — 4 long, 0 short. Trade your plan and manage risk first. Also screened: $CRWV, $ANET, $META, $TSM, $ALAB, $QCOM.
Inflection61
Probability69
Quality92
NVDA is coiling between its rising 200-SMA at 190.73 and a declining 50-SMA at 210.02, with price at 194.97 sitting just 2.22% above long-term trend support — a classic inflection where the medium-term uptrend is being retested while shorter-term momentum has rolled over.
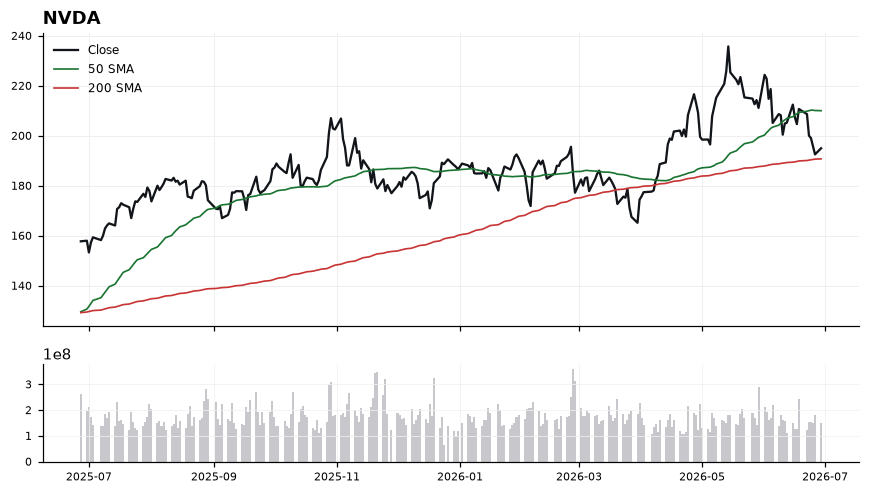
EntryTiered accumulation 191.00–194.50, with confirmation add on a reclaim of 200.00 (round-number/midpoint between 190.73 and 210.02).
InvalidationDaily close below 188.50; breaking the 190.73 200-SMA on a closing basis invalidates the long-term uptrend support and the working long bias.
Targets210.02 (50-SMA, first major resistance and mean-reversion objective) → 220.00+ on a clean 50-SMA reclaim, opening room back toward prior range highs
TimeframeSwing (2-6 weeks)
Inflection57
Probability69
Quality89
AVGO is testing a critical inflection point, trading at 372.45 just 3.08% above its rising 200-SMA (361.33) while sitting well below its 50-SMA (411.45). The setup pits a Long bias against near-term momentum weakness, with the 200-SMA acting as the line in the sand for the prevailing uptrend.
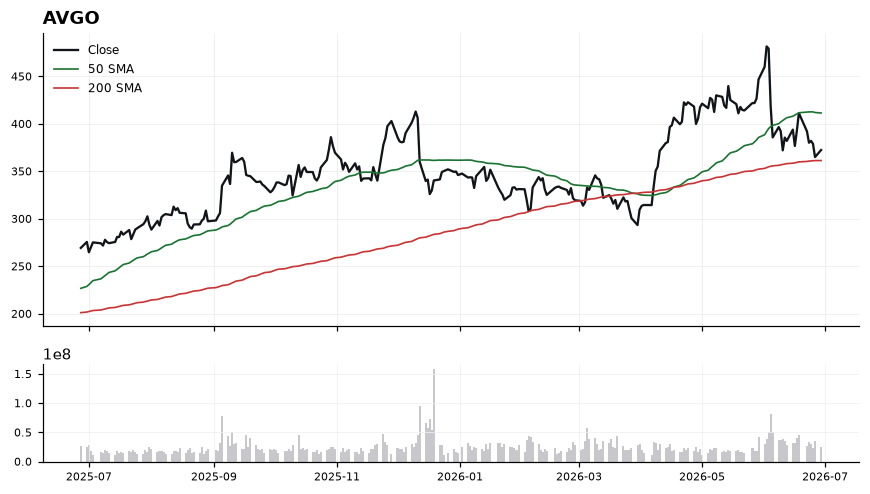
Price has corrected sharply from the 50-SMA at 411.45 and now sits in a mid-range RSI zone of 42.47, signaling weakness but not yet oversold capitulation. MACD at -10.62 versus signal -7.55 confirms downside momentum is still expanding, suggesting the base-building process may not be complete. However, the proximity to the 200-SMA (361.33) creates a structurally favorable risk/reward zone, and the trade-quality score of 88.6 alongside profit-probability of 69.0 supports patient accumulation. A reclaim of momentum requires MACD to curl up toward its signal and RSI to push back above 50.
EntryStaged entry: initial tranche on stabilization in the 365-372 zone near the 200-SMA; add on confirmation only above 385 with MACD crossing its signal line.
InvalidationDaily close below 358 invalidates the thesis — breaking the 200-SMA (361.33) would signal a regime shift from uptrend correction to potential trend reversal.
TargetsFirst target 405 — reversion to the underside of the 50-SMA (411.45) → Second target 430 — reclaim and extension above the 50-SMA on momentum confirmation
TimeframeSwing (2-6 weeks)
Inflection54
Probability69
Quality92
AMZN sits between its rising 200-SMA (232.82) and a declining bias against its 50-SMA (255.94), creating a compression setup where the working long bias must be re-validated above mean reversion levels. With price 3.15% above the 200-SMA and RSI at 46.2, the tape is at a decision point rather than in trend.
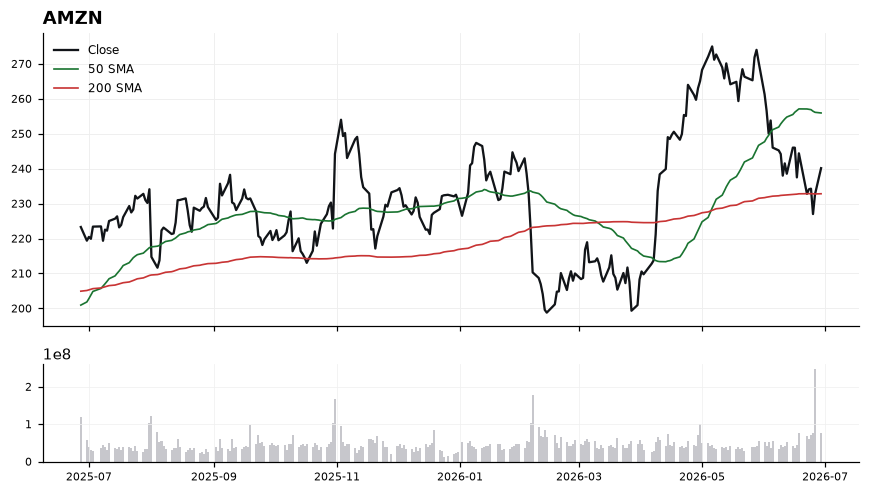
Price at 240.14 trades below the 50-SMA (255.94) but holds above the 200-SMA (232.82), a classic mid-range posture that favors reaccumulation if 232–233 holds. RSI at 46.2 is neutral-soft, leaving room to rally without overbought risk, while MACD at -6.20 versus signal -5.62 confirms momentum has not yet crossed up. The 50-SMA at ~256 caps upside until reclaimed, and the 3.15% cushion to the 200-SMA is thin enough that a daily close below 232.82 would flip the structural read. Trade-quality (91.5) and profit-probability (69.0) support patience for a defined trigger rather than chasing.
EntryStaggered accumulation 236.00–240.50 with confirmation add on a reclaim/close back above 246.00; avoid initiating into the 50-SMA at 255.94 without a MACD bullish cross.
InvalidationDaily close below 231.50 (just under the 200-SMA at 232.82); breaking this invalidates the long-term uptrend reference and shifts the bias from pullback-buy to trend-break.
TargetsFirst target 255.94 at the 50-SMA — mean reversion objective → Second target 268.00 on a 50-SMA reclaim with MACD cross above signal
TimeframeSwing (2-6 weeks)
Inflection60
Probability61
Quality93
TSLA is coiling between its 50-SMA (405.22) and 200-SMA (418.28) at 411.84, a classic compression zone where the trend regime gets decided. With trade-quality scoring 92.6 but momentum still soft, this is a Watch setup pending confirmation of which moving average asserts control.
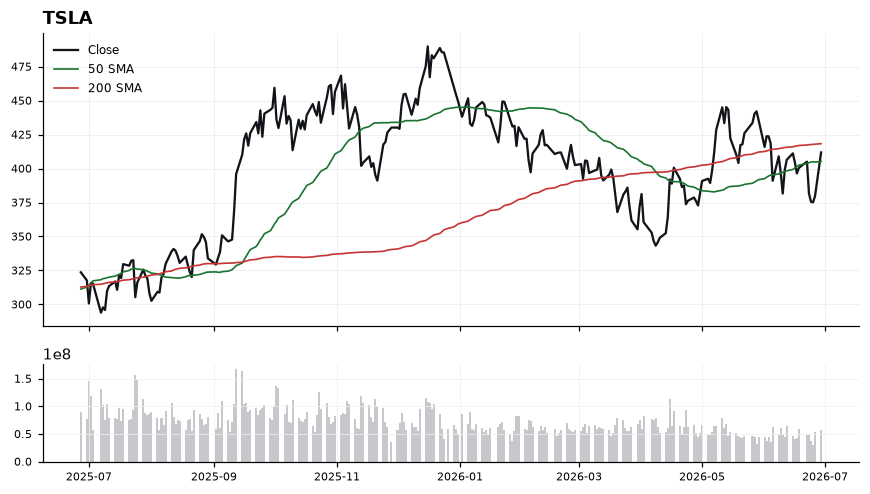
Price sits 1.54% below the 200-SMA, putting the longer-term trend filter directly overhead as resistance at 418.28. RSI at 54.02 is constructive but non-committal, while MACD at -5.79 is still beneath its signal line at -4.66, indicating momentum has not yet flipped positive. The 50-SMA at 405.22 has been catching price from below, so the structure is a tightening range between 405 support and 418 resistance — the next decisive close outside that band sets directional bias.
EntryTrigger long on a confirmed reclaim of the 200-SMA at 418.28 (entry zone 418.30–420.00); alternative pullback entry near the 50-SMA at 405.22–407.00 only if MACD curls back above its signal.
InvalidationInvalidation on a daily close below 403.00 (under the 50-SMA), which would break the higher-low structure and shift the working bias from Watch to defensive.
TargetsFirst target 428.00 — measured move above 200-SMA reclaim → Second target 440.00 — extension once MACD confirms positive cross
TimeframeSwing (2-6 weeks)
Inflection54
Probability64
Quality91
AAPL is pulling back within a longer-term uptrend, trading at 281.74 — below the 50-SMA (291.86) but holding a 4.45% cushion above the rising 200-SMA (269.73). With RSI at 39.90 and MACD at -2.92 versus signal -0.18, momentum is washed out enough to set up a potential mean-reversion inflection from the 200-day shelf.
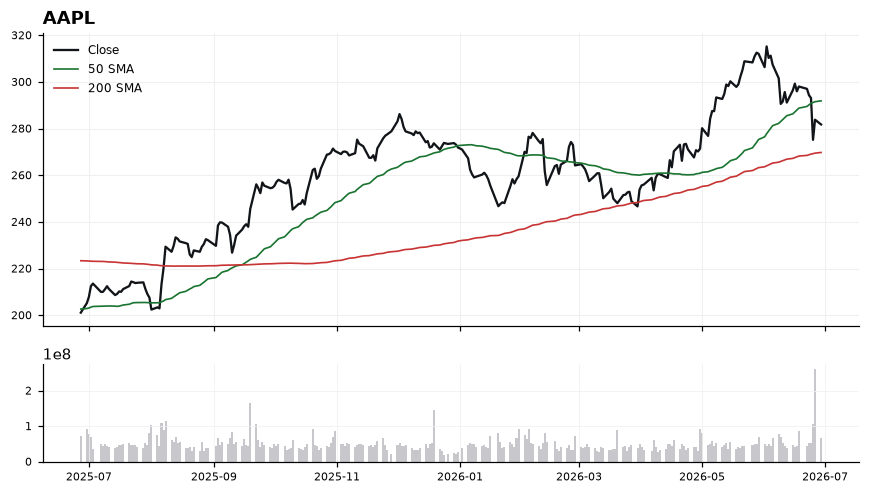
Price has lost the 50-SMA at 291.86, confirming near-term distribution, while the MACD spread (-2.74) shows momentum still accelerating to the downside without yet flipping back up. RSI at 39.90 is in the lower-neutral zone — pressured but not oversold — leaving room for either a flush toward the 200-SMA or a base-build above it. The 200-SMA at 269.73 is the structural pivot; as long as that holds, the broader trend bias remains constructive, consistent with the 90.7 trade-quality and 64.0 profit-probability scores.
EntryStagger longs: starter on stabilization in the 278–282 zone with RSI turning up; add on a reclaim of 285 and confirmation on a close back above the 50-SMA at 291.86.
InvalidationDaily close below 269.73 (200-SMA). Breaking that level removes the trend support cushion and invalidates the long thesis, shifting the structure from pullback-in-uptrend to trend break.
TargetsFirst target: 291.86 — reclaim of the 50-SMA, where prior support becomes resistance. → Second target: 298–300 — recovery of the pre-pullback shelf and MACD cross back above signal.
TimeframeSwing (2-6 weeks)
Ranked by technical inflection, profit-probability, and trade quality. Educational only. Not financial advice.