Price at 275.15 sits below the 50-SMA (291.15) but above the 200-SMA (269.21), confirming a short-term pullback inside a structurally intact long-term trend. MACD at -1.59 versus signal 1.20 shows momentum still negative and unconfirmed, so any bounce remains tactical until MACD curls toward its signal line. The compressed gap between price and the 200-SMA, combined with sub-35 RSI, historically marks zones where dip-buyers reassert control, but a clean break of 269.21 would shift the structural read. Trade-quality scoring of 92.1 and inflection score of 67.1 support a constructive bias, while profit-probability at 64.0 argues for disciplined sizing.
Friday Playbook — Top 5 Setups
The day's five highest-conviction setups, ranked by technical inflection, profit-probability, and trade quality — 3 long, 2 short. Trade your plan and manage risk first. Also screened: $TSLA, $GOOGL, $MU, $SMCI, $ANET, $QCOM.
Inflection67
Probability64
Quality92
AAPL is testing a critical support shelf just 2.21% above its rising 200-SMA (269.21) while RSI(14) at 32.20 flags oversold conditions, setting up a potential mean-reversion inflection within a longer-term uptrend.
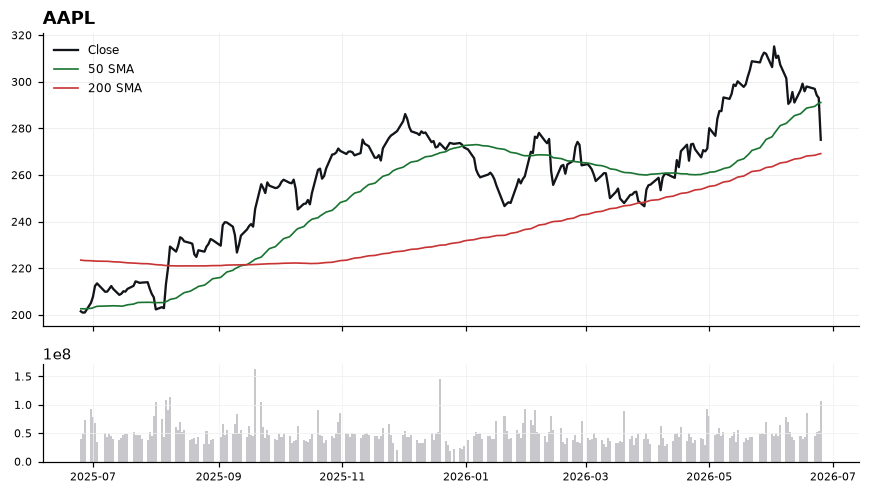
EntryStage entries on stabilization in the 272.00–276.00 zone, with a confirmation trigger on a reclaim of 280.00 alongside MACD turning up toward its signal line.
InvalidationDaily close below 268.00 (under the 200-SMA at 269.21) invalidates the long thesis, signaling a regime shift from pullback-in-uptrend to broader trend breakdown.
TargetsFirst target 291.00, retest of the 50-SMA at 291.15 where supply likely re-emerges → Second target 303.00, prior swing extension on momentum reset
TimeframeSwing (2-6 weeks)
Inflection60
Probability64
Quality92
NVDA is testing a critical inflection zone, trading at 195.74 — sandwiched between its rising 200-SMA at 190.53 (just 2.73% below) and a reclaimed 50-SMA at 210.21 overhead. With RSI at 39.58 and MACD at -2.94 below signal -1.32, the tape is oversold-leaning into structural support, setting up a binary test of the long-term trend.
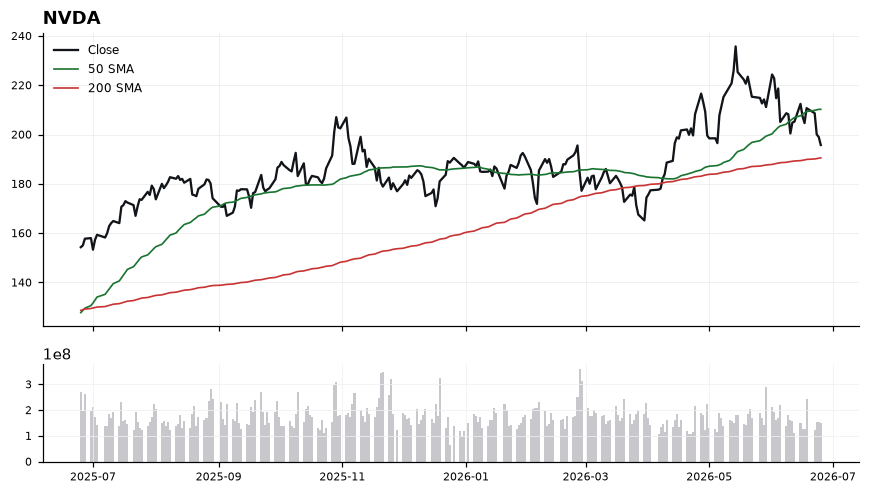
Price sits below the 50-SMA (210.21) but above the 200-SMA (190.53), confirming a near-term pullback within an intact longer-term uptrend. RSI at 39.58 signals fading momentum but is not yet oversold, leaving room for further drift toward the 200-SMA. MACD at -2.94 vs signal -1.32 shows downside momentum is still expanding, so a bullish crossover has not yet printed. The 2.73% cushion to the 200-SMA is the line in the sand — holding it preserves the long bias; losing it shifts the regime.
EntryAccumulation zone 191.00-196.00, with a confirmation trigger on a reclaim of 200.00 accompanied by a MACD bullish cross toward the signal line.
InvalidationDaily close below 188.00 — this would breach the 200-SMA (190.53) decisively, invalidating the long-term trend support and the working long bias.
Targets210.00 — reclaim of the 50-SMA (210.21) as initial resistance → 220.00 — extension above the 50-SMA confirming trend resumption
TimeframeSwing (2-6 weeks)
Inflection65
Probability56
Quality92
AMZN is testing a critical pivot, trading at 227.01—just below the 200-SMA at 232.80 (-2.49%) and well under the 50-SMA at 256.45. With a working short bias, the setup is at inflection: price has lost its long-term mean and is probing whether the 200-day flips from support to resistance.
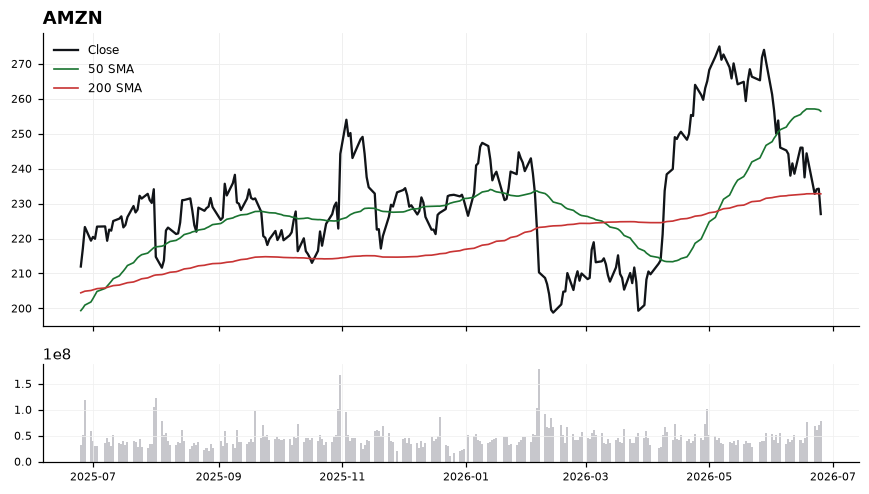
The 50-SMA sits above the 200-SMA, but price has broken beneath both, signaling a momentum rollover. RSI(14) at 33.63 is approaching oversold, suggesting near-term downside is partially priced and a reflex bounce into resistance is plausible. MACD at -6.87 versus signal -5.13 confirms downside momentum is still expanding, not yet curling up. The cluster between 232.80 (200-SMA) and 256.45 (50-SMA) defines the bear's ceiling; rejection there validates trend continuation.
EntryPreferred short entry on a retest of the 232.00–235.00 zone (reclaim attempt of the 200-SMA at 232.80) that fails to hold. Secondary trigger: a decisive breakdown and close below 225.00 confirming continuation from current 227.01.
InvalidationInvalidation on a sustained close above 240.00. Breaking that level would signal the 200-SMA has been reclaimed as support and open the path back toward the 50-SMA at 256.45, neutralizing the short thesis.
TargetsFirst target 218.00 — measured move below the 200-SMA and prior consolidation shelf → Second target 210.00 — extension level where RSI exhaustion and mean-reversion buyers typically re-engage
TimeframeSwing (2-6 weeks)
Inflection50
Probability69
Quality87
AVGO at 378.91 sits in a no-man's-land between its rising 200-SMA (361.17) and a broken 50-SMA (412.60), creating a tactical long inflection where dip-buyers must defend the longer-term trend or cede control to sellers.
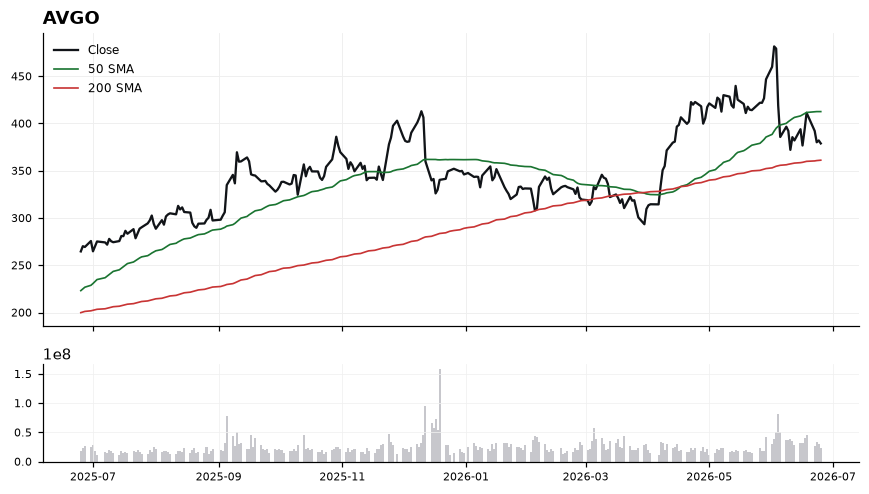
Price trades 8.2% below the 50-SMA but holds a 4.91% cushion above the 200-SMA, indicating an intermediate pullback within a still-intact longer-term uptrend. RSI at 43.27 is neutral-to-soft with room to rebuild before overbought, while MACD at -8.68 below its -5.94 signal confirms momentum has not yet turned. Trade-quality scores 87.4 and profit-probability 69.0 support a constructive bias, but the technical-inflection reading of 49.7 argues for patience until price stabilizes above near-term pivots. The 361-371 zone (200-SMA and recent shelf) is the line in the sand for the bull case.
EntryTiered accumulation: first tranche on a controlled retest of 365-372 (just above the 200-SMA), second tranche on a momentum trigger reclaiming 388-392 with MACD curling toward its signal line.
InvalidationDaily close below 358 invalidates the setup; this would break the 200-SMA (361.17) and signal a regime shift from pullback to trend change.
TargetsFirst target 410-414, retest of the 50-SMA (412.60) as overhead resistance → Second target 438-445, prior swing supply zone above the 50-SMA
TimeframeSwing (3-6 weeks)
Inflection60
Probability61
Quality79
CRWV is coiling just beneath its 200-SMA at 100.68 with price at 98.76, sitting in a no-man's land where a bearish working bias is being tested by an oversold-leaning tape. The inflection: a decisive rejection of the 200-SMA reopens the downside, while a reclaim flips the short thesis.
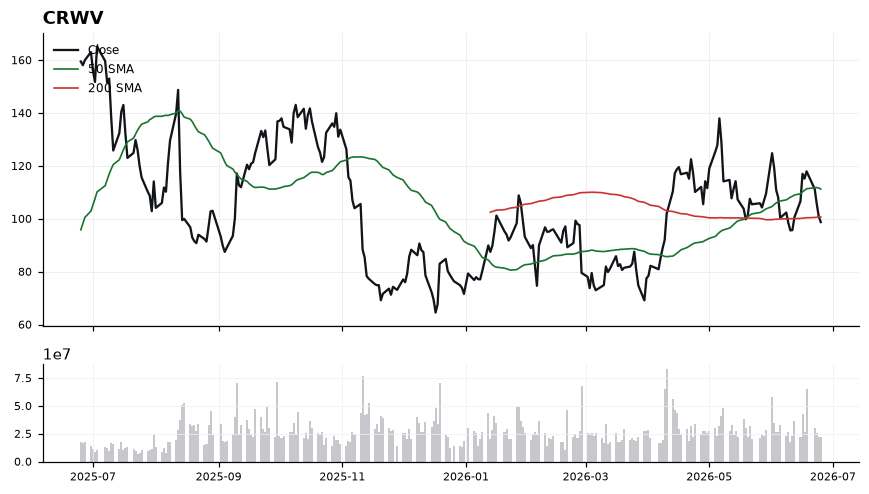
Price is -1.91% below the 200-SMA (100.68) and a deeper 11.25% below the 50-SMA (111.28), confirming a downward-sloping trend structure. MACD at -0.91 sits below its signal at -0.43, indicating momentum is still rolling over, not bottoming. RSI at 43.08 is mid-range — neither oversold nor showing bullish thrust — leaving room for further downside before exhaustion. The configuration favors fading strength into the 200-SMA rather than chasing weakness.
EntryShort zone 100.50–101.50 on a failed retest of the 200-SMA (100.68); aggressive trigger on a daily close back below 98.00 confirming rejection.
InvalidationDaily close above 103.50 — invalidates the lower-high structure beneath the 50-SMA and signals a momentum regime change back above the 200-SMA.
Targets94.50 — prior reaction shelf and first measured move from the 200-SMA rejection → 89.75 — extension toward a -10% stretch from the 200-SMA where mean-reversion odds rise
TimeframeSwing (2–4 weeks)
Ranked by technical inflection, profit-probability, and trade quality. Educational only. Not financial advice.