Price at 192.53 is pinned between rising long-term support (200-SMA 190.64) and overhead supply at the declining 50-SMA (210.09), defining a clear 18-point reaction range. RSI at 37.49 is approaching oversold without confirming it, suggesting selling pressure is fading but not exhausted. MACD at -3.70 versus signal -1.79 remains in a bearish posture with no crossover yet, so momentum has not turned — this is a level-based setup, not a momentum-confirmed one. The razor-thin 0.99% cushion to the 200-SMA means the entire long thesis hinges on that line holding on a closing basis.
Monday Playbook — Top 5 Setups
The day's five highest-conviction setups, ranked by technical inflection, profit-probability, and trade quality — 4 long, 1 short. Trade your plan and manage risk first. Also screened: $TSLA, $CRWV, $ANET, $MU, $TSM, $MSFT.
Inflection68
Probability64
Quality93
NVDA is testing its 200-day SMA (190.64) from above while sitting 8.4% below its 50-day (210.09), creating a classic mean-reversion inflection where the long-term trend support meets oversold momentum. With trade-quality scoring 92.9 and price just 0.99% above the 200-day, the tape is at a high-information juncture: hold and rebuild, or lose the trend.
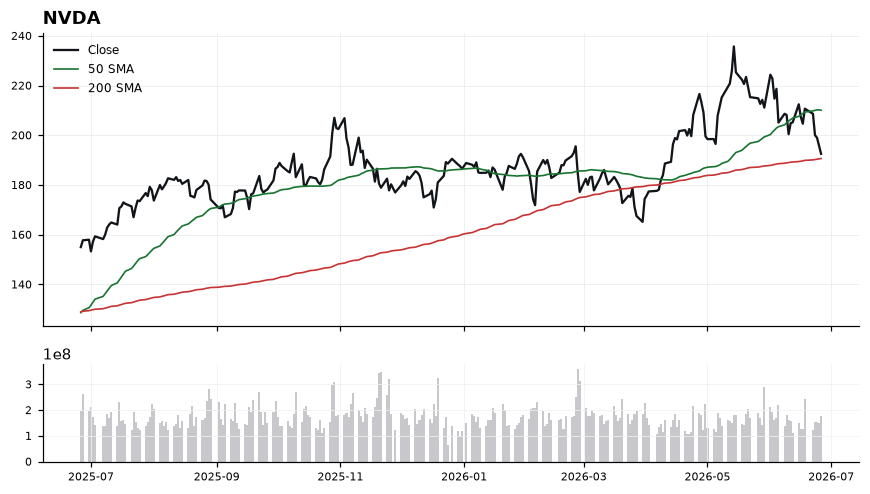
EntryStage entries on confirmation of the 200-SMA shelf: initial tranche 191.00–193.00 on intraday holds of the 200-SMA; add-on above 198.50 to confirm a reclaim of near-term structure.
InvalidationDaily close below 188.50 (roughly 1% under the 200-SMA at 190.64); breaking it signals a loss of the long-term trend and likely opens a deeper retrace toward prior demand.
TargetsFirst target 205.00 — mean reversion into the underside of the declining 50-SMA at 210.09 → Second target 215.00 — reclaim and acceptance above the 50-SMA, reactivating the prior uptrend
TimeframeSwing (2-6 weeks)
Inflection66
Probability64
Quality90
AVGO is testing a critical technical pivot, hovering just 1.03% above its 200-SMA at 361.32 while trading well below the 50-SMA at 411.97 — a classic long-bias inflection where the bull trend either reasserts or fails.
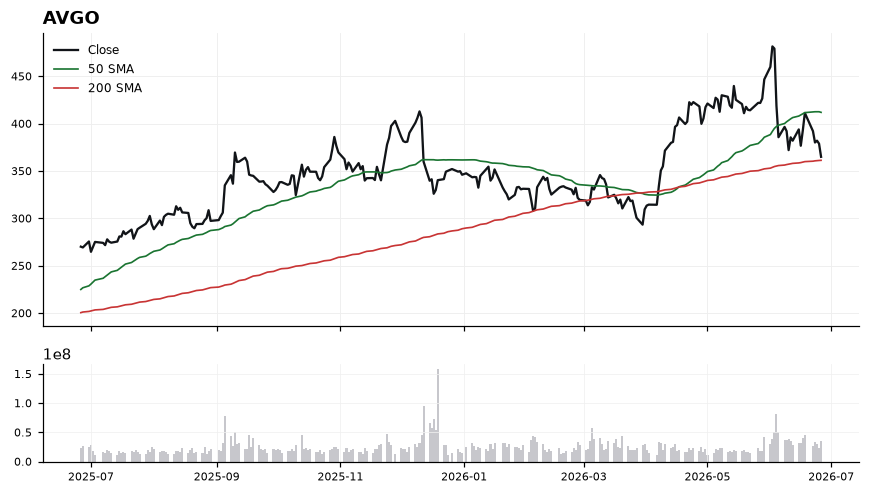
Price at 365.02 is wedged between rising long-term support (200-SMA 361.32) and overhead resistance from the 50-SMA at 411.97, marking a roughly 13% supply zone above. RSI(14) at 39.83 reflects washed-out but not oversold conditions, leaving room for mean reversion if the 200-SMA holds. MACD at -10.17 versus a signal of -6.78 confirms downside momentum is still active, so any long setup is counter-trend until momentum curls. The technical-inflection score of 65.7 and trade-quality of 89.9 frame this as a high-quality setup contingent on the 200-SMA defending price.
EntryStaged entries on a hold of the 361-365 zone (200-SMA reclaim), with confirmation on a reclaim of 372 and MACD histogram narrowing toward the signal line.
InvalidationDaily close below 355 invalidates the thesis — it would mark a decisive loss of the 200-SMA and shift the structure from pullback to trend break.
TargetsFirst target 395 — mid-gap between current price and the 50-SMA, where prior consolidation likely caps the first leg. → Second target 412 — convergence with the 50-SMA at 411.97, the key trend-resistance to overcome for bull continuation.
TimeframeSwing (2-6 weeks)
Inflection69
Probability56
Quality94
AMZN is pinned to its 200-day SMA at 232.77 with price at 232.69 (-0.03% away), creating a binary inflection point after rolling over from the 50-day at 256.13. Working bias is short into this critical moving average, where a decisive breakdown would confirm trend deterioration.
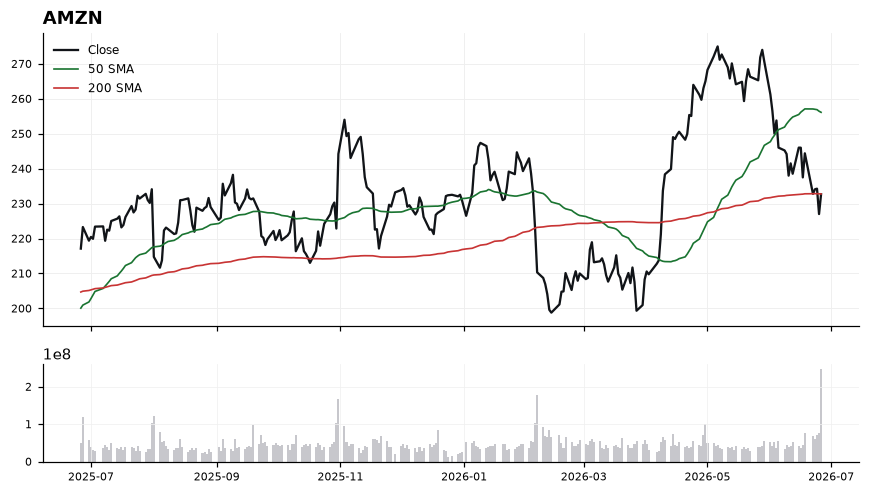
Price trades roughly 9.2% below the 50-SMA (256.13) and is kissing the 200-SMA (232.77) from above, a textbook retest zone after the prior leg lower. RSI(14) at 39.49 reflects sub-50 weakness without being oversold, leaving room for further downside, while MACD at -6.88 versus its signal at -5.48 confirms a bearish cross with momentum still expanding to the downside. The Trade-Quality score of 93.6 and Technical-Inflection score of 69.4 underscore that this is a high-clarity setup pivoting on whether the 200-SMA holds.
EntryShort trigger on a confirmed daily close below 232.00 (loss of the 200-SMA at 232.77); alternatively, fade a relief bounce into the 238-242 zone if price rejects below the 50-SMA glide path.
InvalidationInvalidation on a daily close back above 242.50; reclaiming this level would negate the breakdown thesis and signal the 200-SMA is acting as support rather than resistance.
TargetsFirst target 222.00 (measured move below the 200-SMA retest) → Second target 212.50 (extension toward prior structural support)
TimeframeSwing (2-6 weeks)
Inflection50
Probability69
Quality90
AAPL is trading at 283.78, wedged between a rising 200-SMA support at 269.46 and a declining 50-SMA resistance at 291.50 — a classic mean-reversion inflection within a longer-term uptrend.
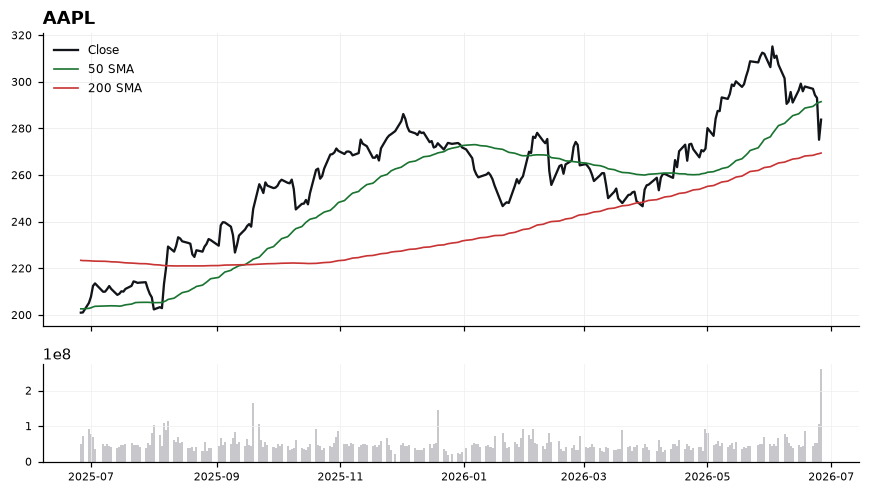
Price sits 5.31% above the 200-SMA but ~2.6% below the 50-SMA, signaling a healthy pullback rather than trend break. RSI at 41.25 is in the lower-neutral zone with room to rebuild without being oversold, while MACD at -2.26 versus a 0.51 signal confirms active downside momentum that has not yet stabilized. Trade-quality (90.1) and profit-probability (69.0) are strong, but technical-inflection at 49.7 argues for patience until momentum turns. The structure favors accumulation on weakness toward the 200-SMA shelf, not chasing strength into the 50-SMA cap.
EntryStaged longs in the 275.00–280.00 zone, with a preferred add on a reclaim of 285.50 alongside a MACD histogram upturn; avoid initiating above 290.
InvalidationDaily close below 268.00 (under the 200-SMA at 269.46) — invalidates the long-term uptrend support and shifts bias to neutral/defensive.
TargetsFirst target 291.50 at the 50-SMA — primary resistance to clear → Second target 298.00–301.00 on a 50-SMA reclaim, retesting prior swing supply
TimeframeSwing (2-6 weeks)
Inflection48
Probability64
Quality89
GOOGL is pulling back into a long-side inflection: price at 337.39 sits 7.50% above the rising 200-SMA (313.85) but has lost the 50-SMA (369.28), with RSI at 33.27 flagging oversold conditions into a higher-timeframe support shelf.
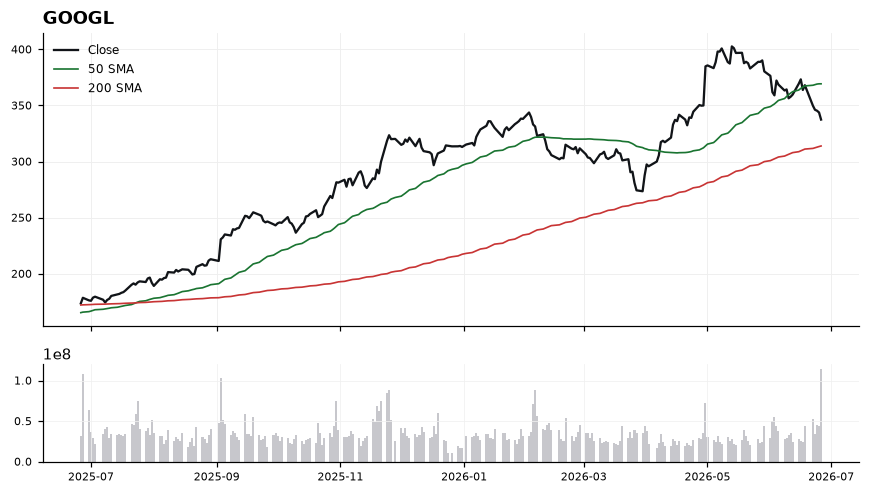
The trend structure remains constructive — price above the 200-SMA which sits below the 50-SMA — but momentum has rolled over, with MACD at -7.35 beneath its signal at -4.11, confirming an active downside impulse. RSI at 33.27 is approaching washed-out territory, typically where mean-reversion attempts emerge when the broader trend is intact. The decisive battleground is the 313.85 (200-SMA) zone versus reclaiming the 369.28 (50-SMA); the ~32-point gap between price and the 50-SMA quantifies the recovery runway if buyers step in near the 200-day.
EntryStagger longs into the 325–315 zone, prioritizing reactions at/just above the 200-SMA (313.85); a confirmation trigger is a daily close back above 340 with MACD histogram turning up.
InvalidationDaily close below 310 (≈1.2% under the 200-SMA) — this would break the higher-timeframe trend support and invalidate the dip-buy thesis, opening trend-change risk.
TargetsFirst target 355 — mean-reversion toward the underside of the 50-SMA region → Second target 369 — tag of the 50-SMA (369.28) where trend re-acceptance would be tested
TimeframeSwing (2-6 weeks)
Ranked by technical inflection, profit-probability, and trade quality. Educational only. Not financial advice.