The technical structure is constructive: 50-SMA is well above the 200-SMA confirming a bullish regime, and MACD at 5.96 versus signal 3.79 shows momentum still expanding rather than rolling over. However, RSI at 71.20 is in overbought territory, suggesting the move is mature and a pullback or consolidation toward the 102.79 (200-SMA) shelf would be healthy. The narrow 5.21% cushion to the 200-SMA means risk is asymmetric — strong if support holds, but a loss of that line would materially weaken the thesis.
Saturday Playbook — Top 5 Setups
The day's five highest-conviction setups, ranked by technical inflection, profit-probability, and trade quality — 4 long, 0 short. Trade your plan and manage risk first. Also screened: $TSM, $ORCL, $META, $MRVL, $VRT, $MU.
Inflection59
Probability78
Quality77
HOOD is trending firmly above both its 50-SMA (82.80) and 200-SMA (102.79), with price at 108.15 sitting just 5.21% above the long-term trend line — a classic continuation setup, but RSI at 71.20 flags a near-term inflection where buyers must defend the breakout zone to keep the bias intact.
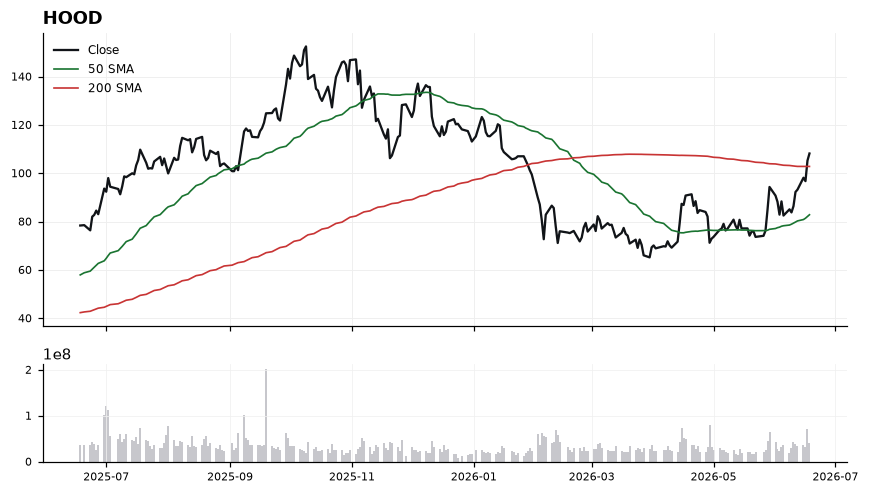
EntryPreferred entry on a pullback into the 103.00–105.50 zone (just above the 200-SMA at 102.79); alternative momentum trigger on a decisive close above 110.00 with MACD still expanding.
InvalidationInvalidation on a daily close below 100.50 — this would break the 200-SMA at 102.79, flip the distance-to-trend signal negative, and signal that the leg up from the 50-SMA (82.80) has failed.
TargetsFirst target 115.00 — measured continuation of the current momentum leg while RSI remains elevated → Second target 122.00 — extension target if MACD holds above its signal line and price sustains above 110.00
TimeframeSwing (2-6 weeks)
Inflection50
Probability75
Quality91
TSLA is coiling just below its 50-SMA (402.49) and ~3.95% under the 200-SMA (416.96), with a neutral RSI of 47 framing the tape as a classic inflection between trend repair and continued distribution.
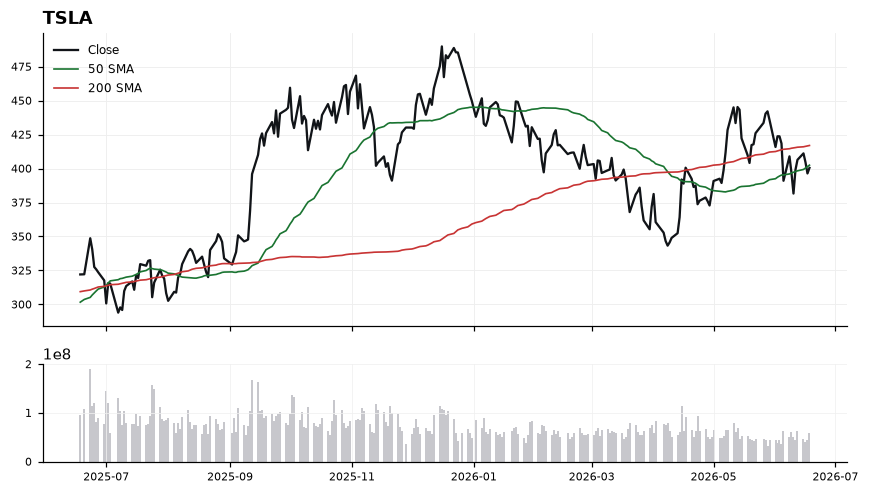
Price at 400.49 is pinned to the 50-SMA (402.49), making this level the immediate pivot — reclaim opens the path back toward the 200-SMA, rejection cedes control to sellers. MACD at -2.85 vs signal -0.50 confirms negative momentum that is still widening, a caution flag against premature longs. RSI at 47 shows neither oversold conditions nor exhaustion, suggesting range behavior until a catalyst forces a break. The -3.95% gap to the 200-SMA is meaningful but not extended, keeping mean-reversion in play if buyers defend.
EntryWatch zone, two scenarios: (1) reclaim and hold above 402.49 (50-SMA) with momentum turning, or (2) flush-and-reclaim of the 392-395 area for a higher-quality long trigger.
InvalidationInvalidation on a daily close below 392; breaking that signals the 50-SMA has flipped to resistance and opens downside continuation away from any mean-reversion thesis.
TargetsFirst target 416.96 (200-SMA) — the gravitational level that defines trend recovery → Second target 428-432 — extension zone above the 200-SMA if momentum re-engages
TimeframeSwing (2-6 weeks)
Inflection49
Probability69
Quality90
AMZN is trading at 244.39, wedged between rising 200-SMA support at 232.80 and overhead 50-SMA resistance at 257.10 — a classic mid-channel inflection where the working long bias hinges on the 200-day holding while momentum resets.
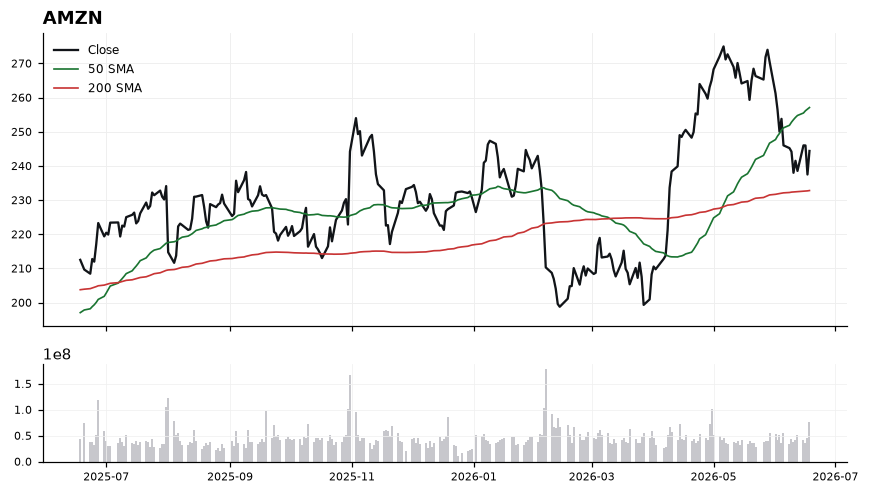
Price sits 4.98% above the 200-SMA, a healthy but not overextended cushion, while the loss of the 50-SMA signals near-term momentum has rolled over. RSI at 44.03 is neutral-soft, leaving room to fall further before becoming oversold, and the MACD at -4.89 below its signal at -3.48 with a widening spread confirms downside momentum is still active. The structural setup remains constructive (price > 200-SMA, uptrend intact), but the tactical tape is corrective — a trade-quality score of 90.3 paired with an inflection score of 48.9 argues for patience on entry rather than chase.
EntryStage entries on a reclaim of 248-250 with MACD curling up, or on a controlled pullback into the 235-238 zone near the 200-SMA where risk/reward improves materially.
InvalidationDaily close below 230 invalidates the thesis — it breaks the 200-SMA and the constructive longer-term structure, shifting the bias to neutral/defensive.
TargetsFirst target 257 at the 50-SMA, where sellers are likely to re-emerge → Second target 268-272 on a clean reclaim and momentum flip
TimeframeSwing (2-6 weeks)
Inflection24
Probability84
Quality86
NVDA is coiling just above its rising 50-SMA (209.31) and well above its 200-SMA (189.90), with the working long bias confronting a near-term momentum stall — RSI at 50.37 and MACD at -1.07 below its signal of -0.11 mark a classic inflection in an uptrend.
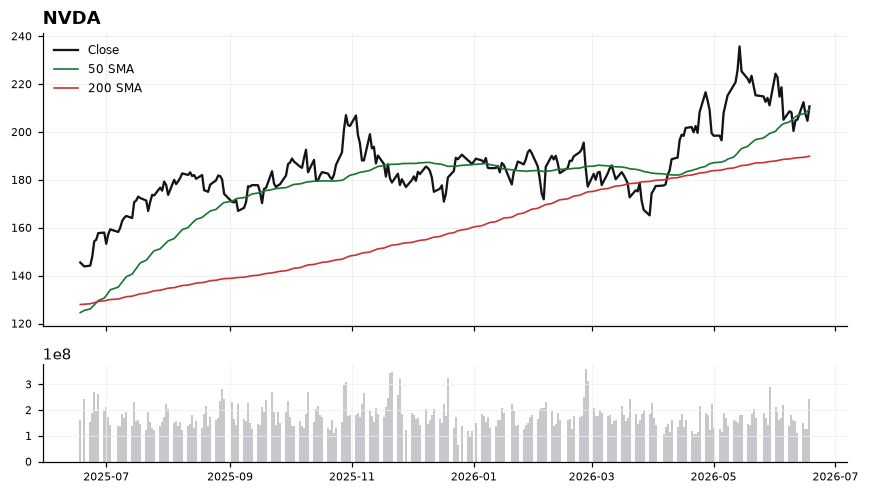
Price at 210.69 sits a slim 0.66% above the 50-SMA and a healthy 10.95% above the 200-SMA, confirming an intact primary uptrend even as short-term momentum flattens. RSI at 50.37 is dead-center neutral, signaling neither distribution nor accumulation has taken control, while the MACD's negative cross under signal (-1.07 vs -0.11) warns that the prior up-impulse has faded. The 50-SMA at 209.31 is the pivot of the entire setup: holding it preserves trend structure, losing it opens an air-pocket toward the 200-SMA. With a profit-probability score of 84 against a low inflection score of 24, the read favors patience for confirmation rather than chasing.
EntryTiered long interest on a reclaim of 211.50 with MACD curling back toward signal; preferred add-zone on a controlled pullback into the 209.30-207.50 shelf (50-SMA test) that holds on a closing basis.
InvalidationClosing break below 205.00 invalidates the 50-SMA support thesis and exposes the gap down toward the 200-SMA at 189.90, negating the long bias.
TargetsFirst target 218.00 — reclaim of recent swing supply where momentum needs to prove itself. → Second target 225.00 — measured extension consistent with trend continuation off the 50-SMA.
TimeframeSwing (2-6 weeks)
Inflection18
Probability98
Quality75
ANET trades at 169.67, holding firmly above both its 50-SMA (158.53) and 200-SMA (142.17) in a textbook stacked-uptrend alignment tied to the AI Infrastructure theme. With RSI at 58.89 and MACD (3.38) extended above signal (2.57), the tape is constructive but already 19.34% above its 200-day, framing this as a trend-continuation read rather than a fresh breakout inflection.
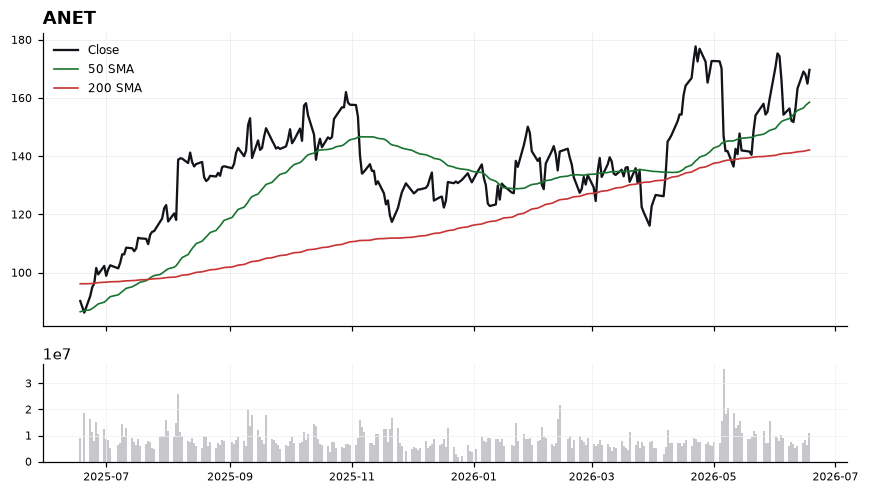
Price/50-SMA spread of roughly 7% and price/200-SMA spread of 19.34% confirm momentum is intact but increasingly stretched, consistent with the modest technical-inflection score of 18.4. RSI at 58.89 sits in the bullish-but-not-overbought zone, leaving room to extend before reaching the 70 threshold. MACD remains positive with a 0.81 spread over its signal line, indicating momentum is still expanding, though the gap is narrow enough that any pullback could compress it quickly. The 50-SMA at 158.53 is the first dynamic support shelf, with the 200-SMA at 142.17 serving as the structural trend floor.
EntryPreferred accumulation on pullback into 160-163 (just above the 50-SMA at 158.53); momentum add-on only on a daily close above 172.
InvalidationDaily close below 157 (under the 50-SMA at 158.53) invalidates the trend-continuation thesis and signals a likely retest of the 142-145 zone.
TargetsFirst: 178-182 (prior momentum extension) → Second: 190-195 (measured trend objective from 50-SMA base)
TimeframeSwing (2-6 weeks)
Ranked by technical inflection, profit-probability, and trade quality. Educational only. Not financial advice.