The trend structure is constructive: 50-SMA above 200-SMA with price leading both, confirming a primary uptrend. RSI at 71.20 is in overbought territory, signaling that chasing strength here carries elevated pullback risk into prior support. MACD's positive spread of ~2.17 over signal shows momentum has not yet rolled, but the gap between price and the 50-SMA argues for mean reversion before the next leg. Key reference levels are the 200-SMA at 102.79 as primary support and the 50-SMA at 82.80 as deeper structural support.
Friday Playbook — Top 5 Setups
The day's five highest-conviction setups, ranked by technical inflection, profit-probability, and trade quality — 4 long, 0 short. Trade your plan and manage risk first. Also screened: $ANET, $TSM, $ORCL, $META, $MRVL, $VRT.
Inflection59
Probability78
Quality77
HOOD is trending firmly above both moving averages with price at 108.15, sitting 5.21% above the rising 200-SMA (102.79) and 30%+ above the 50-SMA (82.80). The setup is at an inflection because momentum is extended (RSI 71.20) yet MACD remains bullish (5.96 vs 3.79 signal), framing a continuation-versus-pullback decision point.
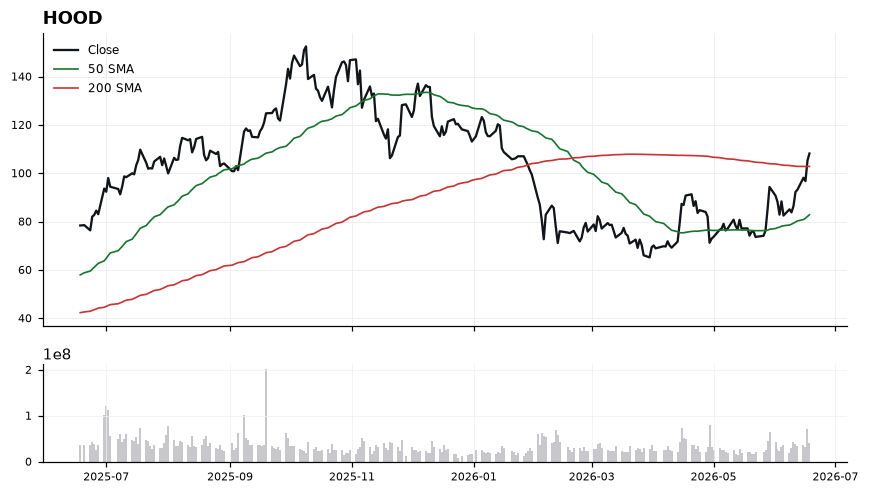
EntryPreferred entry on a pullback into 103.00-105.50 (retest of the 200-SMA shelf); alternatively, a momentum-continuation trigger on a daily close above 110.00 with MACD still expanding.
InvalidationInvalidation on a daily close below 101.50 — losing the 200-SMA (102.79) would break the trend structure and shift bias to neutral/short toward the 50-SMA.
TargetsFirst target 115.00 (measured continuation from current consolidation) → Second target 122.00 (extension objective if momentum persists)
TimeframeSwing (2-6 weeks)
Inflection50
Probability75
Quality91
TSLA is coiling in a tight zone between its 50-SMA (402.49) and current price (400.49), sitting 3.95% below the 200-SMA (416.96) — a classic inflection where a reclaim of the moving averages would flip the tape, while failure keeps the lower-high structure intact.
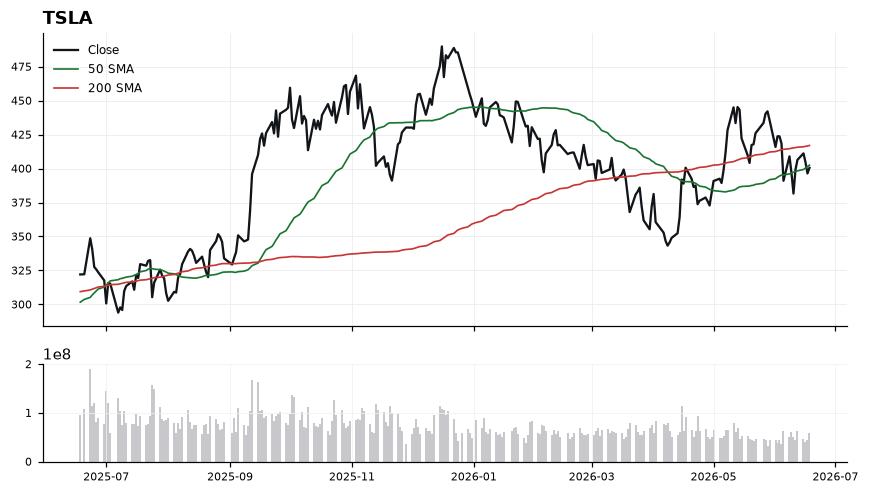
Price is pinned just under the 50-SMA at 402.49 and meaningfully below the 200-SMA at 416.96, signaling the intermediate trend remains contested. RSI at 47.03 is neutral with a slight bearish lean, offering no momentum confirmation in either direction. MACD at -2.85 versus a signal of -0.50 shows momentum still expanding to the downside, with the histogram negative and widening. Until price reclaims 402.49 on a closing basis and momentum curls up, the path of least resistance favors a retest of recent lows before any durable mean-reversion attempt.
EntryTwo-tier watch: aggressive trigger on a daily close back above the 50-SMA at 402.49 with confirmation through 405; preferred reclaim entry on a push and hold above 410, targeting a run at the 200-SMA. Alternative: wait for a flush into the 385–390 demand zone with a reversal candle.
InvalidationInvalidation on a daily close below 388. Breaking that level confirms continuation of the MACD-led downtrend, opens distance from the 200-SMA beyond 7%, and negates the reclaim thesis.
Targets417 — direct test of the 200-SMA at 416.96, the key trend pivot → 432 — extension through the 200-SMA into the prior supply shelf
TimeframeSwing (2-6 weeks)
Inflection49
Probability69
Quality90
AMZN is trading at 244.39, caught between a rising 200-SMA support at 232.80 and a declining 50-SMA resistance at 257.10 — a classic mean-reversion compression that often resolves into a directional move. With RSI at 44.03 (neutral-to-soft) and MACD at -4.89 below its signal at -3.48, momentum has yet to confirm the long bias, making this an inflection setup rather than a breakout.
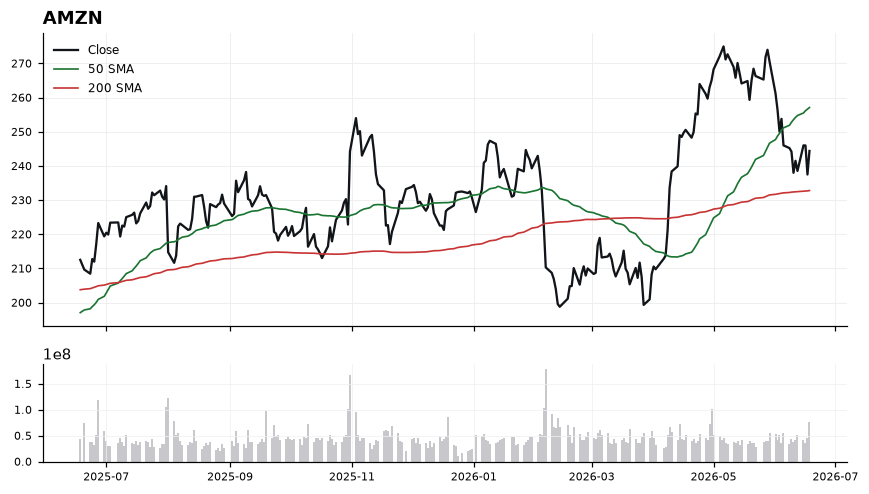
Price sits 4.98% above the 200-SMA, preserving the longer-term uptrend structure, but trades 4.9% below the 50-SMA at 257.10, which now caps any rally attempts. The MACD histogram remains negative (-4.89 vs -3.48 signal), indicating that downside momentum is still in force but not yet extreme. RSI at 44 leaves room to absorb further weakness toward the 200-SMA without triggering oversold conditions, suggesting any long entry should be staged rather than chased. A reclaim of the 50-SMA would be the cleanest signal that the corrective phase has ended.
EntryStage longs in the 236-244 zone, prioritizing a retest of the 232.80 (200-SMA) area; confirmation trigger is a daily close back above 250 with MACD turning up toward its signal line.
InvalidationDaily close below 228 invalidates the setup — it would mean loss of the 200-SMA, flipping the longer-term trend bias and negating the long thesis.
TargetsFirst target 257.10 at the 50-SMA, where prior supply sits → Second target 268-272, a measured move above the 50-SMA assuming momentum re-engages
TimeframeSwing (3-6 weeks)
Inflection29
Probability84
Quality86
AAPL is trending above both its 50-SMA (288.74) and 200-SMA (268.19) at 298.01, but momentum is rolling over as MACD (1.18) has crossed below its signal (3.22) and RSI (50.94) sits mid-range — a classic uptrend pausing at an inflection.
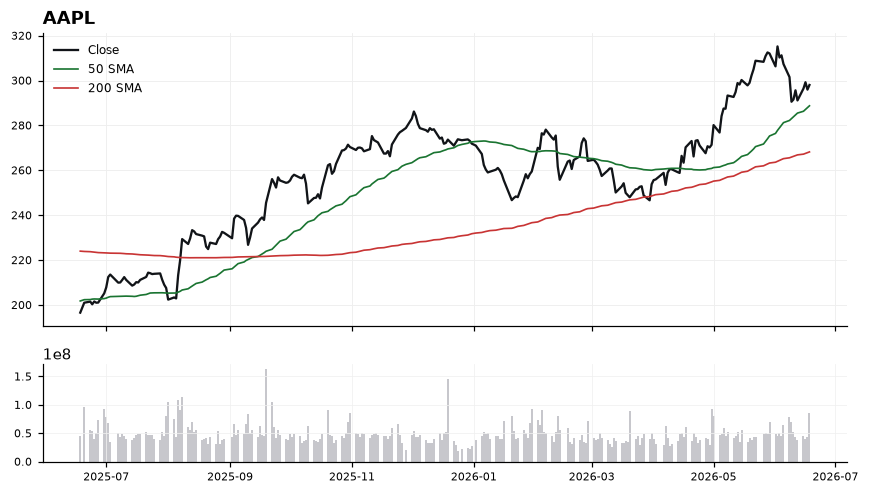
Price holds a 11.12% cushion over the 200-SMA, confirming the broader uptrend remains intact, while the 50-SMA at 288.74 marks the first dynamic support roughly 3% below spot. The MACD bearish cross against a neutral RSI signals waning short-term thrust without distribution, suggesting consolidation rather than reversal. Trade-quality (86.3) and profit-probability (84.0) remain elevated, but the low technical-inflection score (28.8) argues for patience around a defined level rather than chasing strength. A reclaim of momentum would likely require RSI pushing back above 55 with MACD curling toward its signal line.
EntryStagger long entries on a pullback into 289–292 (50-SMA confluence), or on a momentum trigger via a reclaim of 300 with MACD turning up toward signal.
InvalidationClosing break below 285 invalidates the setup — it would breach the 50-SMA, signal a failed trend support, and open a path toward the 200-SMA.
Targets305–308 (recent supply / prior range high retest) → 318–322 (trend extension target above breakout)
TimeframeSwing (2-6 weeks)
Inflection24
Probability84
Quality86
NVDA is pinned at an inflection just above its 50-SMA (209.31) with price at 210.69, sitting 10.95% above the 200-SMA (189.90). RSI at 50.37 and a MACD print of -1.07 below its signal at -0.11 signal momentum has cooled even as the longer-term uptrend structure remains intact.
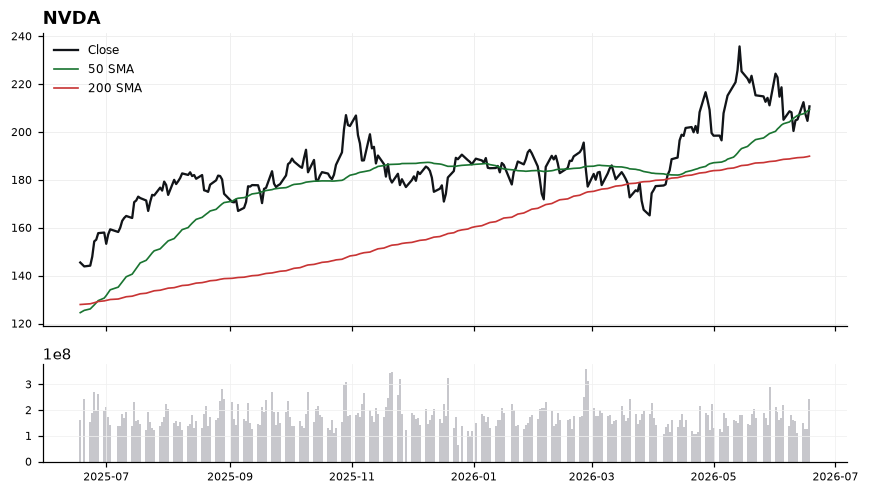
Price is hugging the 50-SMA, making 209.31 the pivot that separates a constructive long bias from a deeper mean-reversion path toward the 200-SMA at 189.90. The negative MACD spread (-1.07 vs -0.11) confirms short-term momentum has rolled over, while RSI at 50.37 sits on the neutral line — neither overbought nor giving an oversold reset. The combination argues for patience: a reclaim higher reasserts trend, while a clean loss of the 50-SMA opens the 10.95% air pocket back to the 200-SMA. Trade-quality (86.4) and profit-probability (84) remain supportive, but the technical-inflection score of 24 flags this as a wait-for-confirmation setup, not a chase.
EntryTiered: starter on a hold and reclaim above 211.50 with MACD turning back toward its signal; add on a stronger momentum push through 214.00. Alternatively, a tactical add on a pullback into 205-207 that holds above the 50-SMA.
InvalidationDaily close below 204.50 invalidates the long thesis — it confirms a loss of the 50-SMA and shifts the path of least resistance toward the 200-SMA at 189.90.
TargetsFirst target 220.00 — recovery of recent momentum highs and MACD bullish crossover zone → Second target 230.00 — trend-extension objective if RSI pushes back above 60
TimeframeSwing (2-6 weeks)
Ranked by technical inflection, profit-probability, and trade quality. Educational only. Not financial advice.