Price sits just 0.05% above the 200-SMA and roughly 1.3% above the 50-SMA, meaning both key trend lines are stacked beneath as tiered support in a bullish alignment. The MACD spread of +1.00 above signal confirms momentum has flipped positive without being extended, and RSI at 52.95 shows the move is still in its early expansion phase. The tape is coiling in a tight band around the 200-day, so a decisive push through will likely define the next multi-week leg. Failure to hold the 947-960 shelf, however, would flip this back into a range fade.
$COST
LongTechnical snapshot
as of Aug 25, 2026Chart
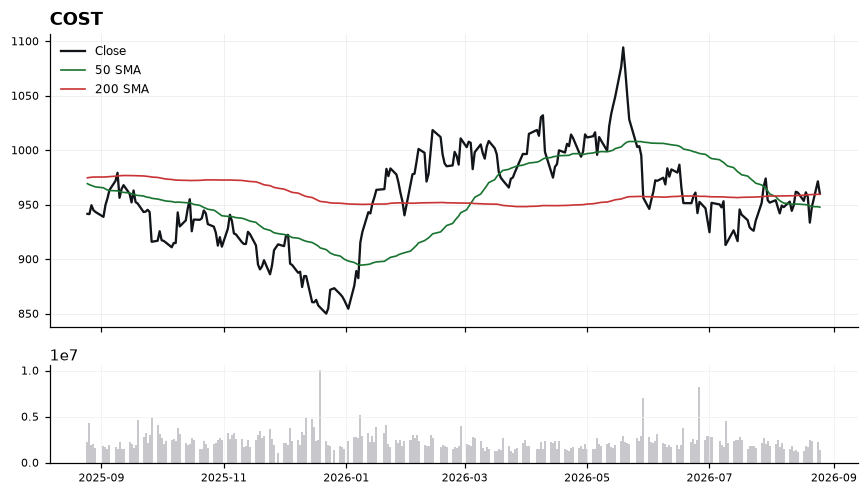
Daily close with 50/200-day SMA and volume · Aug 25, 2026
Latest read
From the Aug 25, 2026 Playbook →Playbook history
- Aug 25, 2026Long#3 · Long · 960.01
- Aug 24, 2026Long#5 · Long · 971.40
- Aug 18, 2026Long#4 · Long · 961.35
- Aug 16, 2026Long#5 · Long · 961.10
- Aug 13, 2026Long#5 · Long · 961.85
- Jul 29, 2026Long#1 · Long · 974.03
- Jul 28, 2026Long#1 · Long · 966.58
COST — frequently asked
- Is COST above its 200-day moving average?
- Yes — $COST is trading 0.00% above its 200-day moving average (around 959.57), which reflects a long-term uptrend. (Educational only, not financial advice.)
- Is COST overbought or oversold?
- COST's 14-day RSI is 53, which is neutral. RSI above 70 is overbought, below 30 is oversold, and in between is neutral. (Educational only, not financial advice.)
- What is COST's RSI?
- COST's current 14-day RSI is 53 (neutral). (Educational only, not financial advice.)
- Is COST in an uptrend or a downtrend?
- COST's 50-day moving average (947.69) is below its 200-day (959.57), a bearish (death-cross) structure. (Educational only, not financial advice.)
- What is the latest read on COST?
- Our most recent Daily Playbook reads COST as Long (#3 · Long · 960.01). (Educational only, not financial advice.)
Get COST signals the moment they fire
Daily Playbook reads, real-time technical alerts, and human-vetted AI analysis across the market's leaders.
Educational only. Not financial advice. Technicals are end-of-day and may lag live prices.