Price has broken below the 50-SMA (197.42) and is now compressed against the 200-SMA (180.06), which historically acts as a decision line for trend continuation. RSI at 28.49 is in oversold territory, suggesting downside momentum is stretched, but MACD at -5.44 versus signal -3.35 confirms bearish momentum has not yet turned. The setup pairs a stretched oscillator with unresolved momentum, meaning the reaction off the 200-SMA is the tell — either a mean-reversion bounce toward the 50-SMA, or a decisive breakdown below trend.
$TXRH
LongTechnical snapshot
as of Sep 14, 2026Chart
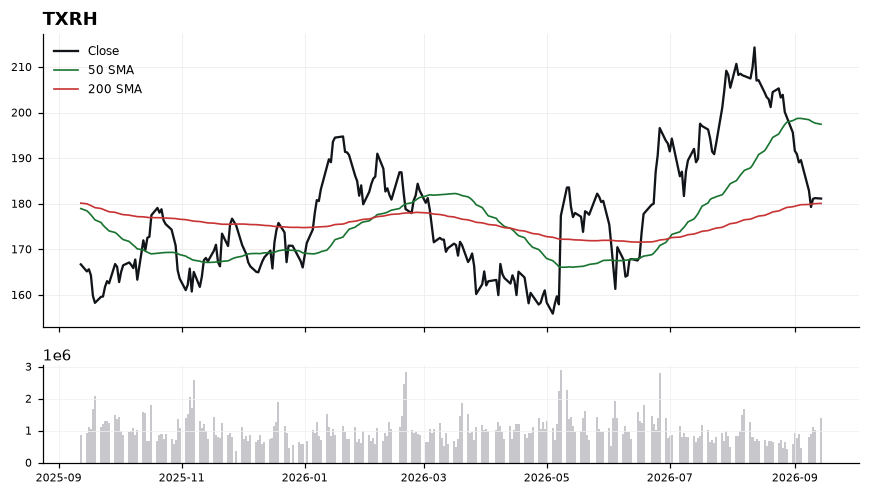
Daily close with 50/200-day SMA and volume · Sep 14, 2026
Latest read
From the Sep 15, 2026 Playbook →Playbook history
- Sep 15, 2026Long#2 · Long · 181.12
- Sep 14, 2026Long#2 · Long · 181.22
- Sep 13, 2026Long#2 · Long · 181.22
TXRH — frequently asked
- Is TXRH above its 200-day moving average?
- Yes — $TXRH is trading 0.60% above its 200-day moving average (around 180.06), which reflects a long-term uptrend. (Educational only, not financial advice.)
- Is TXRH overbought or oversold?
- TXRH's 14-day RSI is 29, which is oversold. RSI above 70 is overbought, below 30 is oversold, and in between is neutral. (Educational only, not financial advice.)
- What is TXRH's RSI?
- TXRH's current 14-day RSI is 29 (oversold). (Educational only, not financial advice.)
- Is TXRH in an uptrend or a downtrend?
- TXRH's 50-day moving average (197.42) is above its 200-day (180.06), a bullish (golden-cross) structure. (Educational only, not financial advice.)
- What is the latest read on TXRH?
- Our most recent Daily Playbook reads TXRH as Long (#2 · Long · 181.12). (Educational only, not financial advice.)
Get TXRH signals the moment they fire
Daily Playbook reads, real-time technical alerts, and human-vetted AI analysis across the market's leaders.
Educational only. Not financial advice. Technicals are end-of-day and may lag live prices.