Price is only 3.01% above the 200-SMA, making that level (22.39) the pivotal line between trend continuation and failed breakout. RSI at 58.92 is bullish but has room to run before overbought, while MACD at 1.86 above its 1.73 signal confirms positive momentum with a modest, not stretched, spread. The 50-SMA at 17.98 sits well below price, reinforcing the medium-term uptrend, and trade-quality (84.6) and profit-probability (83.0) scores align with the long bias despite a middling inflection score (57.9).
$BMNR
LongTechnical snapshot
as of Sep 2, 2026Chart
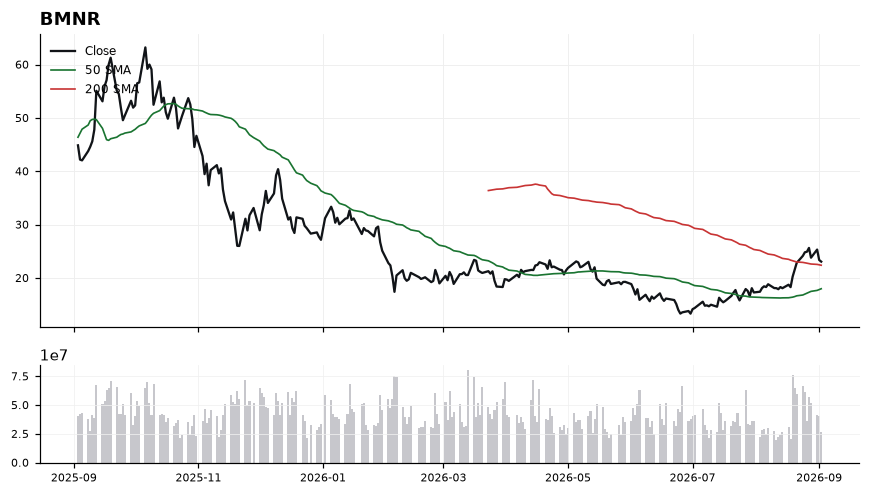
Daily close with 50/200-day SMA and volume · Sep 2, 2026
Latest read
From the Sep 3, 2026 Playbook →Playbook history
- Sep 3, 2026Long#5 · Long · 23.06
- Sep 2, 2026Long#5 · Long · 23.37
- Sep 1, 2026Long#5 · Long · 23.37
BMNR — frequently asked
- Is BMNR above its 200-day moving average?
- Yes — $BMNR is trading 3.00% above its 200-day moving average (around 22.39), which reflects a long-term uptrend. (Educational only, not financial advice.)
- Is BMNR overbought or oversold?
- BMNR's 14-day RSI is 59, which is neutral. RSI above 70 is overbought, below 30 is oversold, and in between is neutral. (Educational only, not financial advice.)
- What is BMNR's RSI?
- BMNR's current 14-day RSI is 59 (neutral). (Educational only, not financial advice.)
- Is BMNR in an uptrend or a downtrend?
- BMNR's 50-day moving average (17.98) is below its 200-day (22.39), a bearish (death-cross) structure. (Educational only, not financial advice.)
- What is the latest read on BMNR?
- Our most recent Daily Playbook reads BMNR as Long (#5 · Long · 23.06). (Educational only, not financial advice.)
Get BMNR signals the moment they fire
Daily Playbook reads, real-time technical alerts, and human-vetted AI analysis across the market's leaders.
Educational only. Not financial advice. Technicals are end-of-day and may lag live prices.