Price is pinned mid-range between the rising 200-SMA support at 337.19 and 50-SMA resistance at 346.06, a classic compression setup. The bullish MACD cross-up beneath zero suggests waning downside momentum, and the trade-quality score (92.5) with profit-probability at 83.0 corroborates a constructive risk/reward. However, RSI at 49.96 confirms no directional conviction yet — a decisive push through the 50-SMA is required to validate the long bias.
Thursday Playbook — Top 5 Setups
The day's five highest-conviction setups, ranked by technical inflection, profit-probability, and trade quality — 5 long, 0 short. Trade your plan and manage risk first. Also screened: $META, $QCOM, $SHOP, $HIMS, $IWM, $BMNR.
Inflection61
Probability83
Quality93
GOOGL is coiling between its 50-SMA (346.06) and 200-SMA (337.19), with price at 342.87 sitting just 1.69% above the long-term trend line. The tape is at an inflection as MACD (-1.60 vs signal -2.57) turns up from negative territory while RSI (49.96) hovers at the neutral pivot.
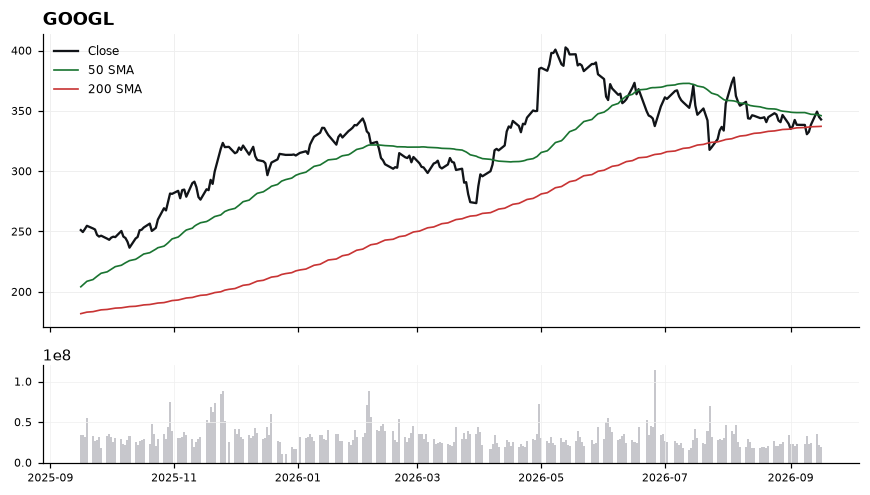
EntryTier 1: 338.00-340.00 on a pullback holding the 200-SMA (337.19). Tier 2: breakout trigger above 346.50 (reclaim of 50-SMA) with momentum confirmation.
InvalidationDaily close below 335.50 (roughly 0.5% under the 200-SMA). Breaking this invalidates the long-term trend support and would flip the structure to distribution, forcing exit.
Targets352.00 — prior swing supply and first extension above the 50-SMA → 360.00-362.00 — measured move from the 337-346 range breakout
TimeframeSwing (2-6 weeks)
Inflection74
Probability64
Quality91
AMAT is testing its 200-day SMA (414.49) from above with price at 415.38, a classic long-bias inflection where a multi-month uptrend proxy is being retested. With RSI at 32.98 near oversold and price sitting ~0.22% above the 200-SMA, the tape is compressed into a decision point.
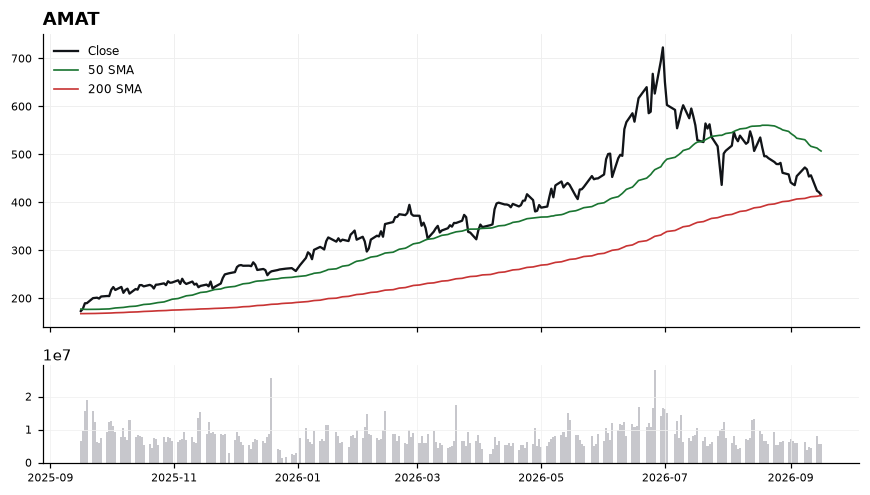
Price has decoupled sharply from the 50-SMA at 507.06, sitting roughly 18% below it, confirming a corrective leg within a broader uptrend still defined by the rising 200-SMA. RSI at 32.98 signals stretched downside momentum without yet flipping to a true oversold reset, while MACD at -22.91 versus signal -20.55 remains negative and slightly widening — momentum has not yet turned. The bull case rests entirely on the 200-SMA (414.49) holding as dynamic support; the bear case is a clean breakdown that opens air beneath. Trade-quality (90.5) and technical-inflection (73.5) scores reflect a high-reward location, not a confirmed reversal.
EntryStaged accumulation zone 414.50–417.00 on a hold of the 200-SMA, with an add-on trigger on a reclaim of 425 accompanied by MACD histogram narrowing toward the -20.55 signal line.
InvalidationDaily close below 408.00 (roughly 1.5% under the 200-SMA at 414.49) invalidates the inflection thesis and signals the long-term trend proxy has failed as support.
TargetsFirst target 455.00, mid-gap between current price and the 50-SMA where prior consolidation sits → Second target 505.00, retest of the declining 50-SMA at 507.06
TimeframeSwing (2-6 weeks)
Inflection68
Probability64
Quality90
LRCX is sitting just 1.23% above its rising 200-SMA (265.97) after a deep pullback from the 50-SMA at 309.96, creating a classic long-side inflection where a major trend support is being retested with momentum stretched to the downside.
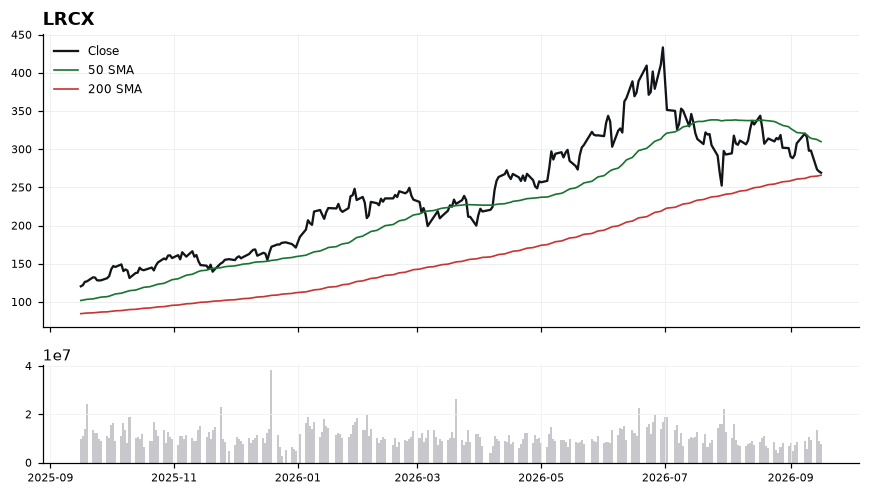
Price at 269.23 has broken well below the 50-SMA (309.96) but is defending the 200-SMA (265.97), framing a tight decision zone between those two moving averages. RSI at 36.03 is near oversold without being washed out, signaling exhausted sellers rather than capitulation, while MACD at -9.61 versus signal -6.02 confirms momentum is still negative and has not yet crossed. The trade-quality score of 89.8 and technical-inflection score of 67.8 reflect a high-quality reward setup, but the pending MACD cross and reclaim of the 50-SMA remain the confirmation gates.
EntryScale-in zone 266.00-270.00 on a hold of the 200-SMA (265.97); add-on trigger on a reclaim of 278.00 with MACD turning up toward its signal line.
InvalidationDaily close below 261.00 (roughly 1.9% under the 200-SMA) invalidates the long thesis, signaling a loss of the multi-quarter trend anchor and opening downside continuation.
TargetsFirst target 295.00 — mean-reversion toward the declining 50-SMA at 309.96 → Second target 310.00-315.00 — tag of the 50-SMA and prior supply zone
TimeframeSwing (2-6 weeks)
Inflection63
Probability69
Quality85
IBIT trades at 43.04, holding above both the 50-SMA (39.35) and 200-SMA (42.16), placing it at an inflection where the long-term trend has flipped constructive but momentum is cooling, with MACD (1.33) now below its signal (1.72).
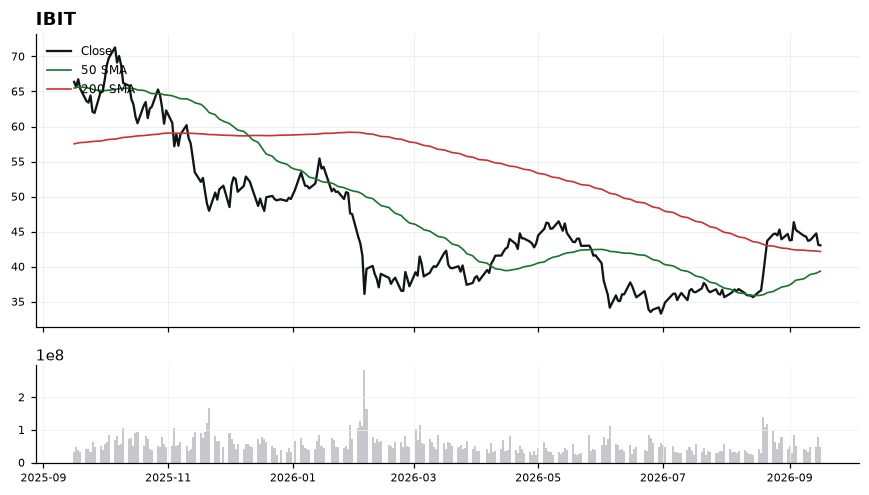
Price sits just 2.08% above the 200-SMA, a thin cushion that makes the 42.16 line the pivotal battleground for the intermediate trend. RSI at 53.85 is neutral-constructive, leaving room to run without overbought risk, while the 50-SMA at 39.35 defines a well-defined uptrend structure below. The MACD bearish cross against a rising trend suggests a pause or shallow pullback rather than reversal, and trade-quality (85.2) plus profit-probability (69.0) support a tactical long bias into weakness.
EntryPreferred accumulation zone 42.20–42.60 on a retest of the 200-SMA; alternative momentum trigger on a reclaim and close above 43.50 with MACD re-crossing higher.
InvalidationDaily close below 41.60 (roughly 1% under the 200-SMA) invalidates the reclaim thesis and signals the intermediate trend is rolling back over toward the 50-SMA at 39.35.
Targets45.00 — prior resistance shelf and measured move from the 50/200-SMA base → 47.25 — extension target aligned with continuation of the trend off the 39.35 50-SMA
TimeframeSwing (2-6 weeks)
Inflection61
Probability64
Quality92
AMZN is a MAG7 long-bias setup coiling between its rising 200-SMA (240.11) and falling 50-SMA (255.55), with price at 245.96 sitting just 2.44% above trend support — a classic inflection where a pullback either resolves higher or confirms a deeper reset.
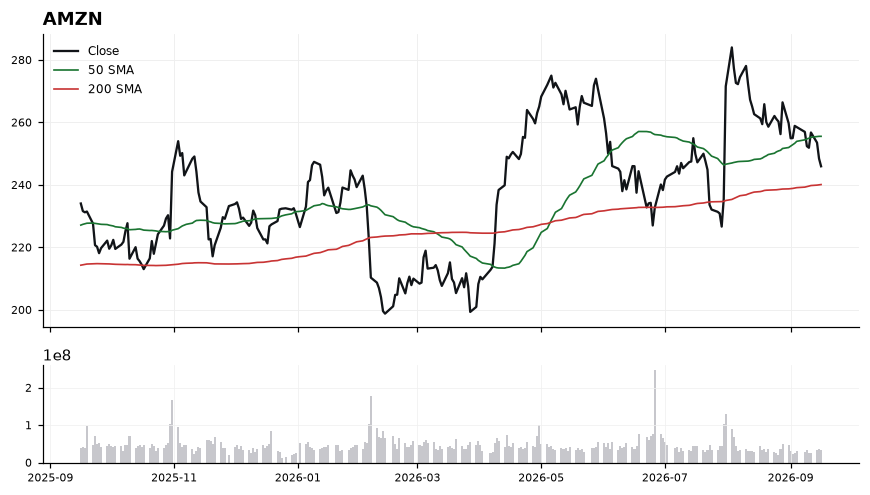
Price at 245.96 trades below the 50-SMA (255.55) but above the 200-SMA (240.11), signaling a short-term correction inside an intact longer-term uptrend. RSI at 39.45 is approaching oversold without being washed out, leaving room for a mean-reversion bounce. MACD at -2.24 versus signal -0.70 remains negative with a widening gap, so downside momentum has not yet inflected — the trade-quality score of 92 reflects structure, but timing requires confirmation. Reclaiming the 50-SMA at 255.55 would be the cleanest technical trigger.
EntryScale-in zone 242.00–246.50 near the 200-SMA (240.11) shelf; add-on trigger on a daily close back above 255.55 (50-SMA) with MACD histogram narrowing.
InvalidationDaily close below 238.00 (roughly 1% under the 200-SMA); losing 240.11 on volume invalidates the long-term uptrend thesis and opens a trend-change scenario.
Targets255.55 — reclaim of the 50-SMA and gap-fill toward recent congestion → 268.00 — extension target above the 50-SMA, ~5% above current 50-SMA
TimeframeSwing (2-6 weeks)
Ranked by technical inflection, profit-probability, and trade quality. Educational only. Not financial advice.