Price is caught in a compression between 325.13 (200-SMA) and 339.54 (50-SMA), creating a narrow ~4.3% band that typically resolves with a directional move. RSI at 41.96 confirms the cooling without signaling capitulation, while the negative MACD-vs-signal spread (0.06 vs 0.46) reflects fading short-term momentum. The fact that the 50-SMA still sits above the 200-SMA preserves the broader uptrend structure, framing this dip as a trend-pullback rather than a reversal. A reclaim of the 50-SMA would reassert the long bias; loss of the 200-SMA would invalidate it.
$JPM
LongJPMorgan Chase · Core coverage · Financials
Technical snapshot
as of Nov 17, 2026Chart
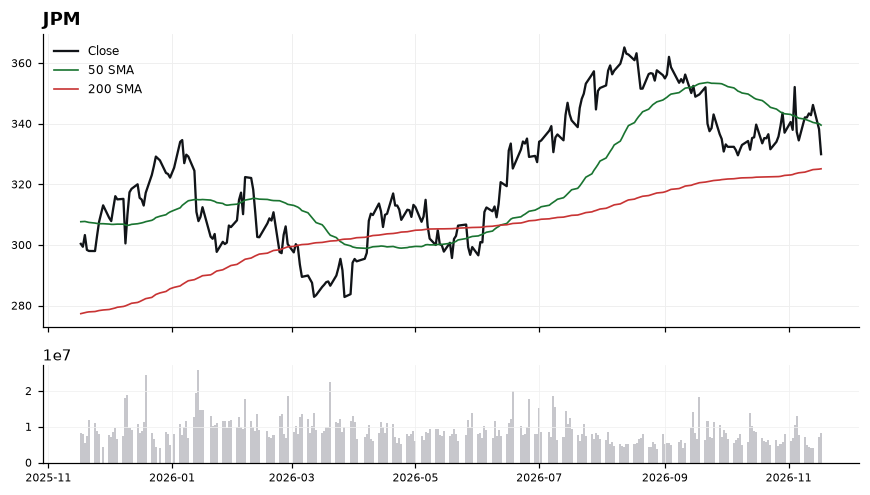
Daily close with 50/200-day SMA and volume · Nov 17, 2026
Latest read
From the Nov 18, 2026 Playbook →Recent signals
| Date | Signal | TF |
|---|---|---|
| Nov 18, 2026 | 🔴 JPM: closed below the 200-day SMA (325.18) at 324.11 | DAILY |
Playbook history
- Nov 18, 2026Long#5 · Long · 329.96
- Nov 11, 2026Long#4 · Long · 342.07
- Nov 10, 2026Long#4 · Long · 342.08
- Oct 26, 2026Long#4 · Long · 331.58
- Oct 25, 2026Long#4 · Long · 331.58
- Oct 21, 2026Long#3 · Long · 335.26
- Oct 15, 2026Long#5 · Long · 335.53
Compare JPM with
All Covered →Related:$GE
JPM — frequently asked
- Is JPM above its 200-day moving average?
- Yes — JPMorgan Chase ($JPM) is trading 1.50% above its 200-day moving average (around 325.13), which reflects a long-term uptrend. (Educational only, not financial advice.)
- Is JPM overbought or oversold?
- JPM's 14-day RSI is 42, which is neutral. RSI above 70 is overbought, below 30 is oversold, and in between is neutral. (Educational only, not financial advice.)
- What is JPM's RSI?
- JPM's current 14-day RSI is 42 (neutral). (Educational only, not financial advice.)
- Is JPM in an uptrend or a downtrend?
- JPM's 50-day moving average (339.54) is above its 200-day (325.13), a bullish (golden-cross) structure. (Educational only, not financial advice.)
- What is the latest read on JPM?
- Our most recent Daily Playbook reads JPM as Long (#5 · Long · 329.96). (Educational only, not financial advice.)
Get JPM signals the moment they fire
Daily Playbook reads, real-time technical alerts, and human-vetted AI analysis across the market's leaders.
Educational only. Not financial advice. Technicals are end-of-day and may lag live prices.