Price sits only 0.72% above the 200-SMA, so the reclaim is still fragile but technically intact, with the 50-SMA roughly 12 points lower confirming a shorter-term uptrend. RSI at 54.01 is constructive but not overbought, leaving room to extend before momentum stretches. MACD at 5.51 over its 3.96 signal line shows a positive and widening momentum spread, consistent with the trade-quality score of 84.1 and profit-probability of 83.0. The technical-inflection score of 62.4 flags this as an actionable but not fully confirmed breakout continuation.
$GE
LongGE Aerospace · Core coverage · Industrials
Technical snapshot
as of Nov 17, 2026Chart
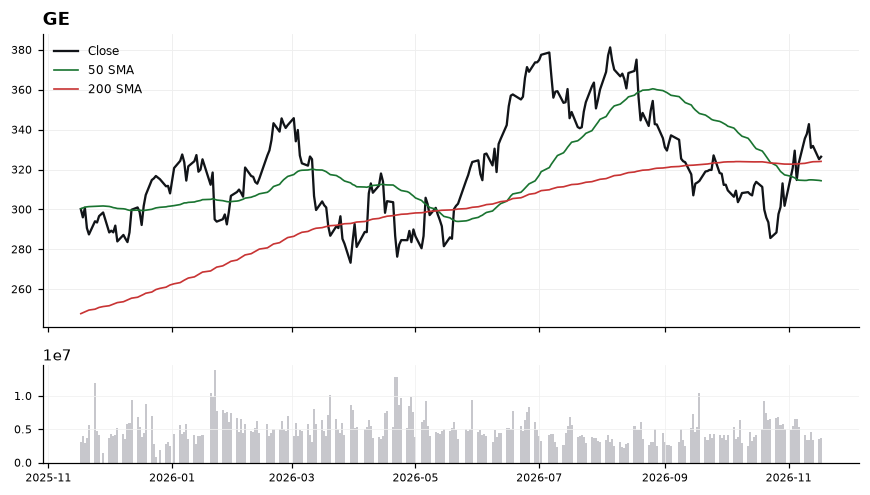
Daily close with 50/200-day SMA and volume · Nov 17, 2026
Latest read
From the Nov 18, 2026 Playbook →Recent signals
| Date | Signal | TF |
|---|---|---|
| Nov 6, 2026 | 🟢 GE: reclaimed the 200-day SMA (322.88) at 323.24 | DAILY |
| Nov 5, 2026 | 🔴 GE: closed below the 200-day SMA (322.74) at 314.73 | DAILY |
| Nov 4, 2026 | 🟢 GE: reclaimed the 200-day SMA (322.76) at 329.45 | DAILY |
Playbook history
- Nov 18, 2026Long#1 · Long · 326.40
- Nov 17, 2026Long#2 · Long · 325.18
- Nov 16, 2026Long#4 · Long · 331.81
- Nov 15, 2026Long#4 · Long · 331.81
- Nov 11, 2026Long#5 · Long · 337.91
- Nov 10, 2026Long#3 · Long · 335.54
- Nov 9, 2026Long#1 · Long · 323.24
- Nov 8, 2026Long#1 · Long · 323.24
- Nov 5, 2026Long#4 · Long · 329.45
Compare GE with
All Covered →Related:$JPM
GE — frequently asked
- Is GE above its 200-day moving average?
- Yes — GE Aerospace ($GE) is trading 0.70% above its 200-day moving average (around 324.07), which reflects a long-term uptrend. (Educational only, not financial advice.)
- Is GE overbought or oversold?
- GE's 14-day RSI is 54, which is neutral. RSI above 70 is overbought, below 30 is oversold, and in between is neutral. (Educational only, not financial advice.)
- What is GE's RSI?
- GE's current 14-day RSI is 54 (neutral). (Educational only, not financial advice.)
- Is GE in an uptrend or a downtrend?
- GE's 50-day moving average (314.37) is below its 200-day (324.07), a bearish (death-cross) structure. (Educational only, not financial advice.)
- What is the latest read on GE?
- Our most recent Daily Playbook reads GE as Long (#1 · Long · 326.40). (Educational only, not financial advice.)
Get GE signals the moment they fire
Daily Playbook reads, real-time technical alerts, and human-vetted AI analysis across the market's leaders.
Educational only. Not financial advice. Technicals are end-of-day and may lag live prices.