Price sits 3.18% above the rising 50-SMA and 5.82% above the 200-SMA, confirming a constructive long-term structure with the shorter average having crossed cleanly above the longer. MACD at 1.30 versus signal 0.72 shows widening positive momentum, but the gap suggests the move is already extended short-term. RSI at 60.89 is bullish but not yet stretched, leaving room toward the 65-70 zone before exhaustion signals typically appear. The 50-SMA at 106.21 is the first dynamic support, with the 200-SMA at 103.57 as the structural line defending the uptrend.
$DIS
LongWalt Disney · Core coverage · Communication Services
Technical snapshot
as of Oct 19, 2026Chart
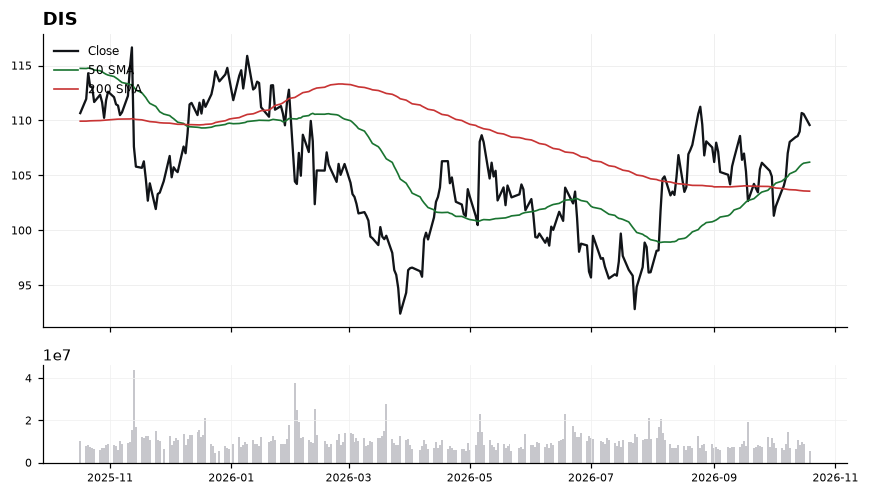
Daily close with 50/200-day SMA and volume · Oct 19, 2026
Latest read
From the Oct 20, 2026 Playbook →Recent signals
| Date | Signal | TF |
|---|---|---|
| Oct 6, 2026 | 🟢 DIS: reclaimed the 200-day SMA (103.78) at 104.03 | DAILY |
Related events
- DIS earningsNov 17, 2026
Playbook history
- Oct 20, 2026Long#5 · Long · 109.59
- Oct 19, 2026Long#5 · Long · 110.59
- Oct 18, 2026Long#5 · Long · 110.59
- Oct 15, 2026Long#4 · Long · 110.68
- Oct 14, 2026Long#4 · Long · 108.99
- Oct 13, 2026Long#3 · Long · 108.49
- Oct 12, 2026Long#3 · Long · 108.49
- Oct 11, 2026Long#4 · Long · 108.05
DIS — frequently asked
- Is DIS above its 200-day moving average?
- Yes — Walt Disney ($DIS) is trading 5.80% above its 200-day moving average (around 103.57), which reflects a long-term uptrend. (Educational only, not financial advice.)
- Is DIS overbought or oversold?
- DIS's 14-day RSI is 61, which is neutral. RSI above 70 is overbought, below 30 is oversold, and in between is neutral. (Educational only, not financial advice.)
- What is DIS's RSI?
- DIS's current 14-day RSI is 61 (neutral). (Educational only, not financial advice.)
- Is DIS in an uptrend or a downtrend?
- DIS's 50-day moving average (106.21) is above its 200-day (103.57), a bullish (golden-cross) structure. (Educational only, not financial advice.)
- What is the latest read on DIS?
- Our most recent Daily Playbook reads DIS as Long (#5 · Long · 109.59). (Educational only, not financial advice.)
Get DIS signals the moment they fire
Daily Playbook reads, real-time technical alerts, and human-vetted AI analysis across the market's leaders.
Educational only. Not financial advice. Technicals are end-of-day and may lag live prices.