Price action confirms a bullish inflection: the 50-SMA (109.70) sits meaningfully below the 200-SMA (118.49), but momentum has carried price back above both, with RSI(14) at 64.20 showing strength without yet reaching overbought extremes. MACD at 3.11 remains above its signal line at 2.73, confirming positive momentum continuation. The tightness between spot and the 200-SMA, however, means the thesis is binary — hold the line and the trend extends, lose it and the reclaim fails. The 8.3% gap between the two SMAs offers a clear structural floor at 109.70 should pressure build.
$WMT
LongWalmart · Core coverage · Consumer Staples
Technical snapshot
as of Oct 28, 2026Chart
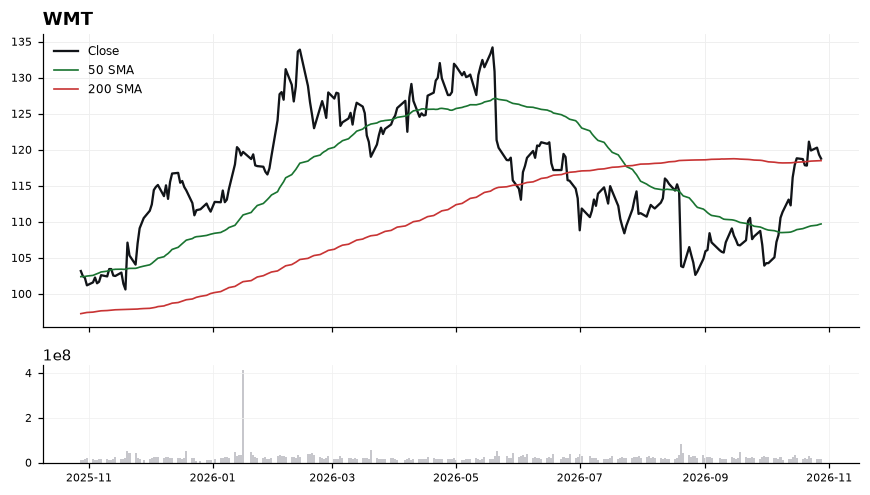
Daily close with 50/200-day SMA and volume · Oct 28, 2026
Latest read
From the Oct 29, 2026 Playbook →Recent signals
| Date | Signal | TF |
|---|---|---|
| Oct 22, 2026 | 🟢 WMT: reclaimed the 200-day SMA (118.39) at 121.12 | DAILY |
| Oct 20, 2026 | 🔴 WMT: closed below the 200-day SMA (118.33) at 117.85 | DAILY |
| Oct 16, 2026 | 🟢 WMT: reclaimed the 200-day SMA (118.27) at 118.81 | DAILY |
Related events
- WMT earningsNov 19, 2026
Playbook history
- Oct 29, 2026Long#1 · Long · 118.77
- Oct 28, 2026Long#3 · Long · 119.32
- Oct 27, 2026Long#4 · Long · 120.29
- Oct 26, 2026Long#3 · Long · 119.89
- Oct 25, 2026Long#3 · Long · 119.89
- Oct 20, 2026Watch#1 · Watch · 118.70
- Oct 19, 2026Watch#1 · Watch · 118.81
- Oct 18, 2026Watch#1 · Watch · 118.81
WMT — frequently asked
- Is WMT above its 200-day moving average?
- Yes — Walmart ($WMT) is trading 0.20% above its 200-day moving average (around 118.49), which reflects a long-term uptrend. (Educational only, not financial advice.)
- Is WMT overbought or oversold?
- WMT's 14-day RSI is 64, which is neutral. RSI above 70 is overbought, below 30 is oversold, and in between is neutral. (Educational only, not financial advice.)
- What is WMT's RSI?
- WMT's current 14-day RSI is 64 (neutral). (Educational only, not financial advice.)
- Is WMT in an uptrend or a downtrend?
- WMT's 50-day moving average (109.70) is below its 200-day (118.49), a bearish (death-cross) structure. (Educational only, not financial advice.)
- What is the latest read on WMT?
- Our most recent Daily Playbook reads WMT as Long (#1 · Long · 118.77). (Educational only, not financial advice.)
Get WMT signals the moment they fire
Daily Playbook reads, real-time technical alerts, and human-vetted AI analysis across the market's leaders.
Educational only. Not financial advice. Technicals are end-of-day and may lag live prices.