The 50/200-SMA alignment (111.15 over 108.79) confirms a constructive longer-term structure, and the 6.25% cushion above the 200-SMA argues trend intact without being overextended. MACD remains negative in absolute terms but the bullish cross versus signal suggests downside momentum is fading. RSI at 57.52 is neutral-to-firm, leaving room for continuation before stretched conditions appear near 70. The key test is whether 115.59 converts from resistance into a launch pad or stalls back toward the 50-SMA.
$AAOI
LongApplied Optoelectronics · Watchlist · Technology
Technical snapshot
as of Oct 2, 2026Chart
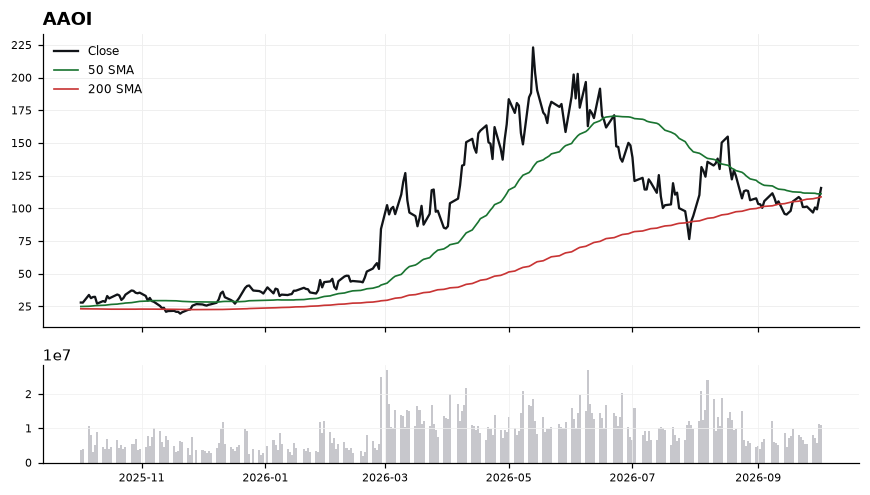
Daily close with 50/200-day SMA and volume · Oct 2, 2026
Latest read
From the Oct 5, 2026 Playbook →Recent signals
| Date | Signal | TF |
|---|---|---|
| Oct 8, 2026 | 🔴 AAOI: closed below the 200-day SMA (110.61) at 105.90 | DAILY |
| Oct 2, 2026 | 🟢 AAOI: reclaimed the 200-day SMA (108.79) at 115.59 | DAILY |
| Sep 23, 2026 | 🔴 AAOI: closed below the 200-day SMA (106.27) at 101.06 | DAILY |
| Sep 18, 2026 | 🟢 AAOI: reclaimed the 200-day SMA (105.08) at 105.17 | DAILY |
| Sep 14, 2026 | 🔴 AAOI: closed below the 200-day SMA (103.61) at 95.76 | DAILY |
| Sep 4, 2026 | 🟢 AAOI: reclaimed the 200-day SMA (101.51) at 105.53 | DAILY |
| Sep 3, 2026 | 🔴 AAOI: closed below the 200-day SMA (101.09) at 100.38 | DAILY |
| Jul 30, 2026 | 🟢 AAOI: reclaimed the 200-day SMA (89.70) at 90.11 | DAILY |
Related events
- AAOI earningsNov 5, 2026
Playbook history
- Oct 5, 2026Long#2 · Long · 115.59
- Oct 4, 2026Long#2 · Long · 115.59
- Sep 23, 2026Long#3 · Long · 107.00
AAOI — frequently asked
- Is AAOI above its 200-day moving average?
- Yes — Applied Optoelectronics ($AAOI) is trading 6.20% above its 200-day moving average (around 108.79), which reflects a long-term uptrend. (Educational only, not financial advice.)
- Is AAOI overbought or oversold?
- AAOI's 14-day RSI is 58, which is neutral. RSI above 70 is overbought, below 30 is oversold, and in between is neutral. (Educational only, not financial advice.)
- What is AAOI's RSI?
- AAOI's current 14-day RSI is 58 (neutral). (Educational only, not financial advice.)
- Is AAOI in an uptrend or a downtrend?
- AAOI's 50-day moving average (111.15) is above its 200-day (108.79), a bullish (golden-cross) structure. (Educational only, not financial advice.)
- What is the latest read on AAOI?
- Our most recent Daily Playbook reads AAOI as Long (#2 · Long · 115.59). (Educational only, not financial advice.)
Get AAOI signals the moment they fire
Daily Playbook reads, real-time technical alerts, and human-vetted AI analysis across the market's leaders.
Educational only. Not financial advice. Technicals are end-of-day and may lag live prices.