Price sits just 0.49% above the 200-SMA, marking the exact battleground between recovery and rejection. RSI at 56.78 confirms improving momentum without overbought stress, leaving room to extend. MACD at -3.31 above its signal at -4.39 shows a bullish crossover forming from below zero, an early-cycle momentum shift. The 50-SMA at 405.62 rising toward the 200-SMA hints at a developing golden-cross backdrop that reinforces the long working bias.
Wednesday Playbook — Top 5 Setups
The day's five highest-conviction setups, ranked by technical inflection, profit-probability, and trade quality — 4 long, 1 short. Trade your plan and manage risk first. Also screened: $AAPL, $TSM, $QCOM, $ANET, $ALAB, $META.
Inflection70
Probability83
Quality93
TSLA is coiling right at the 200-SMA (418.54) with price at 420.60, while the 50-SMA at 405.62 curls up beneath — a classic mean-reversion pivot where a hold above the long-term average would flip the trend structure bullish.
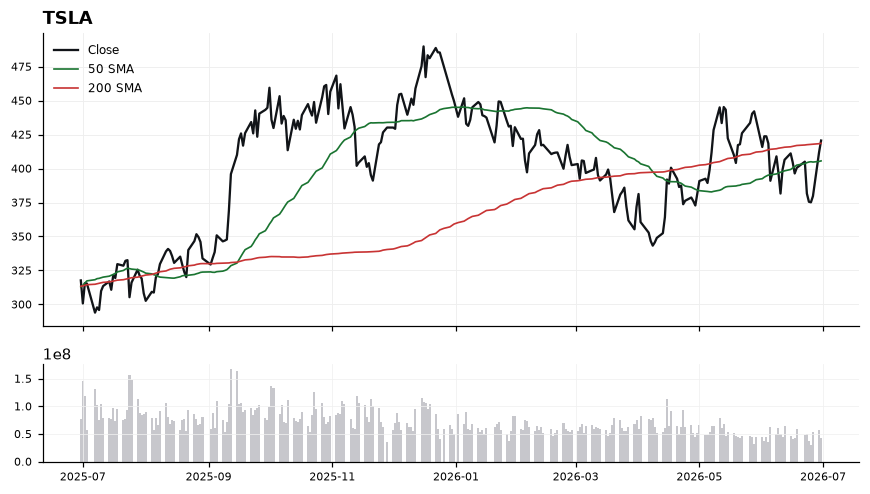
EntryAccumulation zone 418.50–421.00 on a hold above the 200-SMA; add-on trigger on a decisive close above 425.00 to confirm breakout follow-through.
InvalidationInvalidation on a close below 405.50 (loss of the 50-SMA), which would signal the inflection failed and reopen downside toward prior base structure.
TargetsFirst target 438.00 — measured extension from the 50/200-SMA compression → Second target 452.00 — swing objective on sustained MACD expansion above zero
TimeframeSwing (2-6 weeks)
Inflection57
Probability69
Quality92
AMZN is coiling between its rising 200-SMA (232.86) and declining 50-SMA (255.69), with price just 2.35% above long-term trend support — a classic inflection where the long bias either reasserts or fails.
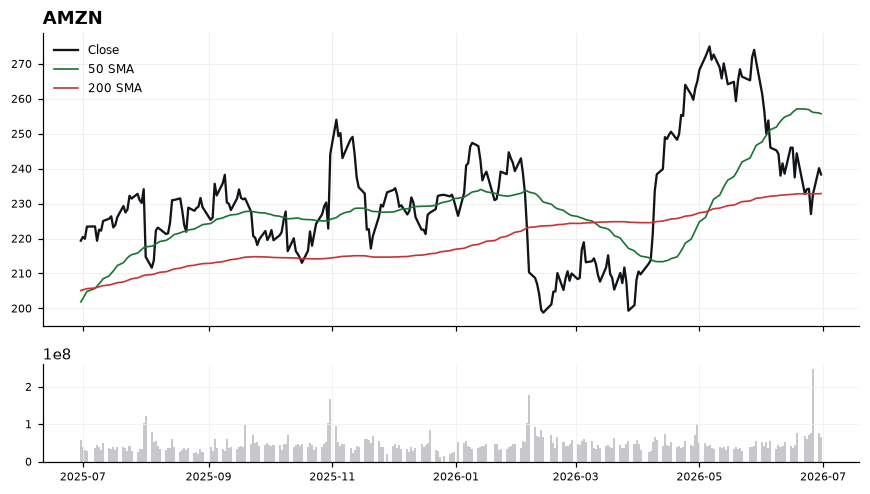
Spot 238.34 sits below the 50-SMA (255.69) but holds above the 200-SMA (232.86), framing a compressed 17-point range that defines the near-term battle. RSI at 44.91 is neutral-soft, indicating momentum has cooled without reaching oversold, while MACD at -5.75 versus signal -5.65 shows a marginal bearish cross that has yet to expand — consistent with a stalled downswing rather than a fresh impulse. The narrow 2.35% cushion to the 200-SMA is the pivotal line; holding it keeps the primary uptrend structurally intact.
EntryPreferred accumulation zone 233.00–236.00 on a controlled test of the 200-SMA (232.86); alternative momentum trigger on a reclaim and 1H close back above 242.50 targeting mean reversion toward the 50-SMA.
InvalidationDaily close below 230.50 invalidates the setup — it would breach the 200-SMA, flip the long-term trend proxy, and negate the working long bias.
TargetsFirst target 250.00, just below the 50-SMA at 255.69 where supply is likely to re-emerge → Second target 258.00–260.00 on a decisive 50-SMA reclaim and MACD bullish cross
TimeframeSwing (2-6 weeks)
Inflection62
Probability61
Quality80
CRWV is coiling right at its 200-SMA (100.49) with price at 99.54, marking a decisive inflection where a well-defined pivot separates a mean-reversion bounce from a trend-confirming breakdown. The working short bias is supported by a MACD (-2.35) trading below its signal (-1.25) and a 50-SMA (110.01) sloping above price, framing a rally-to-resistance setup.
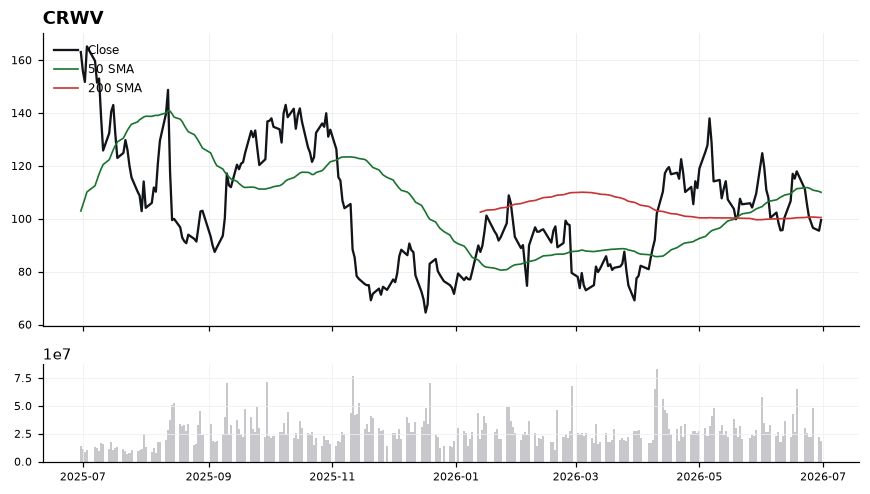
Price sits -0.94% beneath the 200-SMA, a classic reclaim/reject zone, while RSI at 44.87 signals soft momentum without being oversold — leaving room to fade strength. The 50-SMA at 110.01 caps the tape roughly 10.5% overhead, aligning with a downward MACD spread of ~1.10 that suggests momentum is still deteriorating. A recovery back above 100.49 that fails to reclaim would tighten the short thesis, whereas sustained trade below the recent 99.5 shelf opens air toward prior demand.
EntryPrefer to short into strength in the 101.50–103.00 zone (retest of the 200-SMA from below), or on a confirmed breakdown close below 98.75.
InvalidationInvalidation on a daily close above 104.50; breaking this level would reclaim the 200-SMA decisively and put price back on trajectory toward the 50-SMA, negating the momentum-down thesis.
TargetsFirst target 94.00 (measured move from the 200-SMA rejection) → Second target 89.50 (extension as MACD spread expands lower)
TimeframeSwing (2-6 weeks)
Inflection50
Probability69
Quality88
AVGO is caught between a reclaimed 200-SMA (361.42) and a rejected 50-SMA (410.87), setting up a classic mean-reversion inflection for the Semiconductor complex. Price at 377.75 sits just 4.52% above the 200-day, a zone where a Long bias can be defined with tight risk.
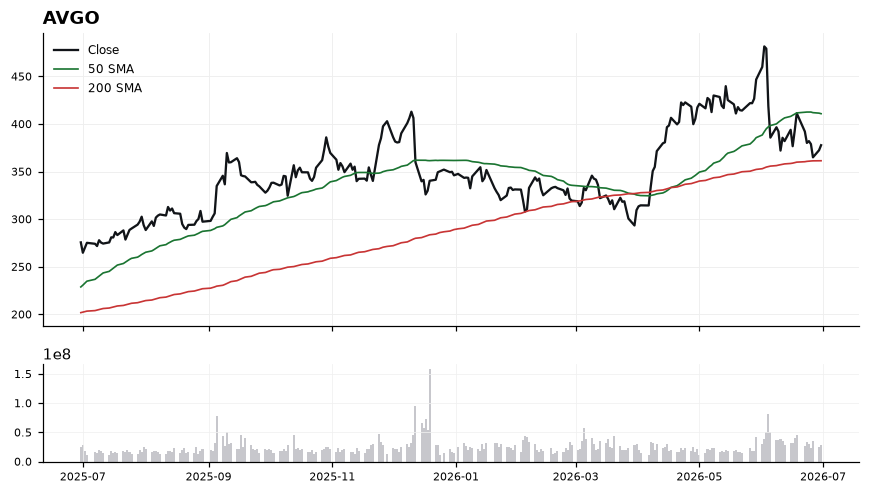
The tape shows constructive-but-unresolved posture: price holds above the rising 200-SMA (361.42) yet trades ~8% below the 50-SMA (410.87), confirming a corrective phase within a broader uptrend. RSI at 44.34 is neutral-soft, leaving room to run before overbought conditions, while MACD at -10.43 below its signal (-8.13) shows momentum still negative but the gap is narrow enough to flip on a few strong sessions. Trade-quality (87.6) and profit-probability (69.0) are elevated, but technical-inflection at 50.3 signals confirmation is required rather than assumed.
EntryStage entries on strength: initial tranche on a reclaim of 385 with MACD crossing its signal line; add on a decisive close back above the 50-SMA at 410.87. Avoid chasing between 378-385 without momentum confirmation.
InvalidationDaily close below 361.42 (the 200-SMA). Losing this level negates the higher-timeframe uptrend structure and would open a path toward deeper mean reversion, invalidating the Long thesis.
TargetsFirst target 410.87 (50-SMA reclaim / prior resistance) → Second target 435-440 zone (extension above 50-SMA on momentum re-expansion)
TimeframeSwing (2-6 weeks)
Inflection49
Probability69
Quality90
NVDA sits at 200.09, wedged between its rising 200-SMA (190.84, +4.85% below) and a declining 50-SMA (209.99) — a classic mean-reversion inflection where the working long bias hinges on the 200-day holding as dynamic support.
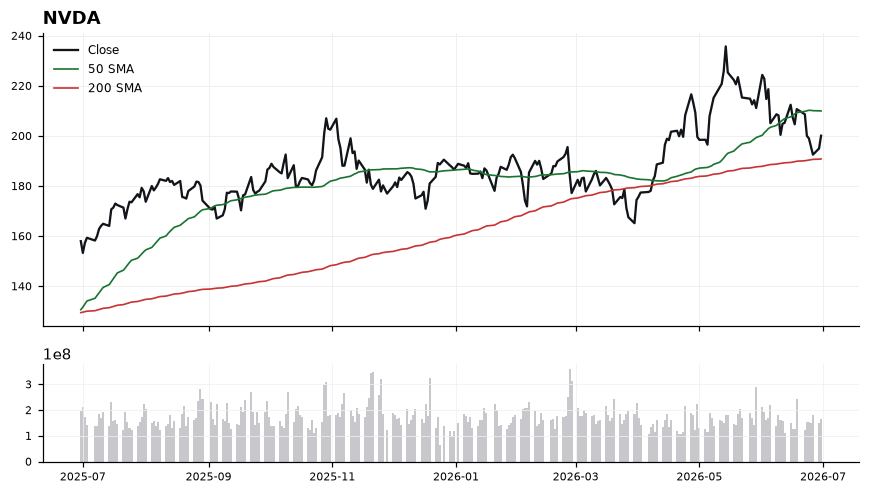
Price trades below the 50-SMA (209.99) but comfortably above the 200-SMA (190.84), signaling a short-term pullback within an intact longer-term uptrend. RSI at 45.21 is neutral-to-soft, leaving room to absorb before oversold, while MACD at -3.88 vs signal -2.57 confirms momentum is still deteriorating and has not yet crossed. Trade-quality (90.4) and profit-probability (69.0) are elevated, but technical-inflection (48.5) argues for patience — the setup is constructive but not yet triggered.
EntryStage entries on a reclaim of 205–210 (50-SMA retake) OR a controlled pullback into 192–195 (just above the 200-SMA at 190.84); avoid chasing in the 200–205 no-man's-land until MACD narrows toward a bullish cross.
InvalidationDaily close below 188.50 — a decisive break of the 200-SMA at 190.84 invalidates the long thesis and signals a regime shift from pullback to trend break.
TargetsFirst target 210–214 (reclaim of 50-SMA at 209.99 and prior consolidation) → Second target 222–226 (measured extension once 50-SMA flips to support)
TimeframeSwing (2-6 weeks)
Ranked by technical inflection, profit-probability, and trade quality. Educational only. Not financial advice.