Price 232.79 sits below the 50-SMA at 257.08 (~9.4% overhead supply) and is mechanically tagging the 200-SMA at 232.84, the last structural support. MACD at -5.60 versus signal -3.90 confirms a widening bearish momentum spread, consistent with the working short bias. However, RSI(14) at 36.54 is approaching oversold without being there, leaving room for either a flush-through or a reflex bounce off the 200-day. The 50-SMA acting as descending resistance frames a lower-highs structure until reclaimed.
Tuesday Playbook — Top 5 Setups
The day's five highest-conviction setups, ranked by technical inflection, profit-probability, and trade quality — 2 long, 1 short. Trade your plan and manage risk first. Also screened: $TSM, $AVGO, $MU, $CRWV, $MRVL, $NVDA.
Inflection72
Probability56
Quality94
AMZN is pinned at its 200-day SMA (232.84) after rolling over from the 50-day (257.08), creating a textbook inflection where the working short either gets confirmed by a clean breakdown or rejected by a mean-reversion bounce. With price -0.02% from the 200-day and trade-quality scoring 93.6, the next directional resolution off this line is the trade.
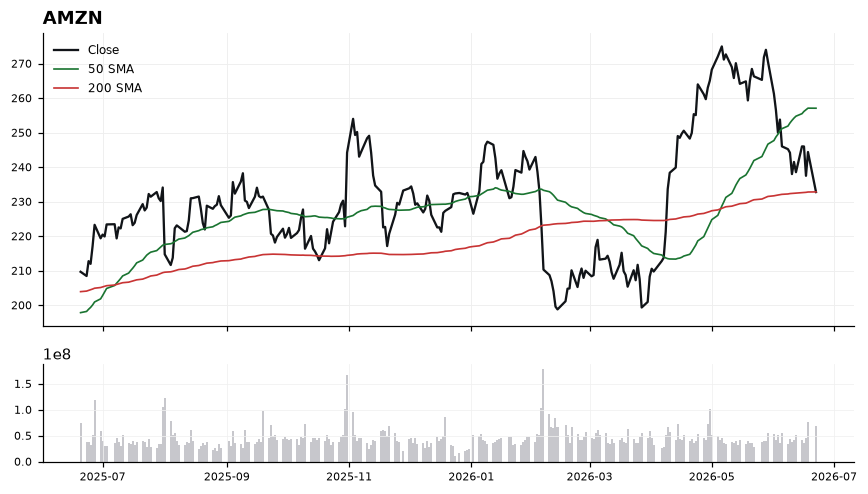
EntryTiered short entries: scale on a confirmed daily close below 232.00 (loss of 200-SMA), or fade strength into the 240-244 zone if a bounce develops without reclaiming the 50-SMA at 257.08.
InvalidationInvalidation on a daily close back above 245.00; breaking that level would signal the 200-SMA defended, RSI reversing off mid-30s, and the lower-highs sequence under the 50-SMA being threatened.
TargetsFirst target 222.00 (measured move below the 200-SMA on momentum continuation) → Second target 212.50 (extension objective if MACD spread keeps widening)
TimeframeSwing (2-6 weeks)
Inflection62
Probability61
Quality88
SMCI is coiling directly at its 200-day SMA (35.53) while the 50-day (33.05) curls higher beneath price, framing a classic mean-reversion inflection where a reclaim or rejection of the long-term trend line dictates the next leg.
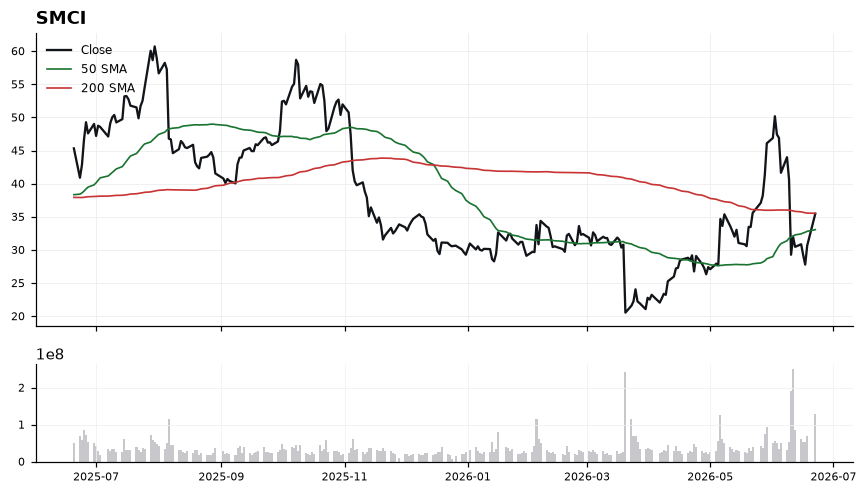
Price at 35.46 sits just -0.19% below the 200-SMA, with RSI at 50.92 confirming a perfectly neutral momentum tape that has not yet committed either way. The 50-SMA at 33.05 has crossed back under spot, providing a rising shorter-term support shelf roughly 7% below. However, MACD at -0.91 versus signal +0.39 shows momentum still negative and below its trigger line, arguing that any upside attempt must first overcome a stale bearish cross before trend confirmation.
EntryWatch for a decisive reclaim and close above 35.53 (200-SMA) with follow-through through 36.00 as the long trigger; alternatively, a pullback into the 33.05–33.50 zone (50-SMA) offers a lower-risk re-entry if support holds.
InvalidationInvalidation on a daily close below 32.80, which would break the rising 50-SMA shelf and signal that the neutral RSI is rolling back into a downtrend rather than basing.
Targets37.80 — first resistance retest above the 200-SMA reclaim zone → 40.50 — measured extension if MACD crosses back above signal
TimeframeSwing (2-6 weeks)
Inflection53
Probability61
Quality92
TSLA is coiled at the 50-SMA (403.68) while trading 2.94% below the 200-SMA (417.32), creating a textbook inflection where the short-term trend is flattening into longer-term resistance. With RSI at 48.92 and MACD (-2.63) below signal (-0.93), the tape is undecided — neither oversold capitulation nor breakout momentum.
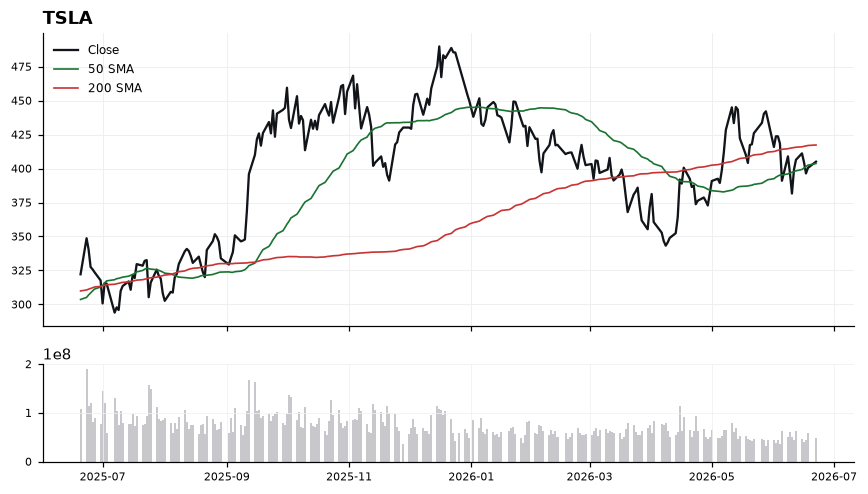
Price at 405.05 is hugging the 50-SMA (403.68), which has acted as the pivot for the recent range; losing it cleanly opens air down to recent demand. RSI at 48.92 sits squarely in neutral territory, confirming the absence of directional conviction, while MACD beneath signal with a 1.70-point gap signals deteriorating short-term momentum that has yet to flush. The 200-SMA at 417.32 caps upside and frames the entire setup: until reclaimed, rallies are counter-trend. Trade-quality scores high (91.7) but technical-inflection is only middling (52.5) — the structure is clean, the trigger is not yet here.
EntryTier 1: reclaim and hold above 417.32 (200-SMA) on a daily close as a trend-change trigger. Tier 2: tactical reclaim of 410-412 with MACD curling toward signal as an early-mover entry. Avoid chasing inside the 403-410 chop zone.
InvalidationDaily close below 400.00 (round-number support just under the 50-SMA at 403.68). A break there confirms loss of the short-term pivot and shifts bias toward a retest of prior swing lows, invalidating the inflection thesis.
TargetsFirst target: 417.32 (200-SMA) — primary overhead resistance and the line that defines the macro trend. → Second target: 430.00 on a 200-SMA reclaim, representing a ~6% extension and prior supply zone.
TimeframeSwing (2-6 weeks)
Inflection30
Probability84
Quality87
AAPL trades at 297.01, holding above a rising 50-SMA (289.47) and well above the 200-SMA (268.49, +10.62%), but momentum has cooled with RSI at 49.89 and MACD (0.97) crossing below signal (2.77) — a classic uptrend-pullback inflection.
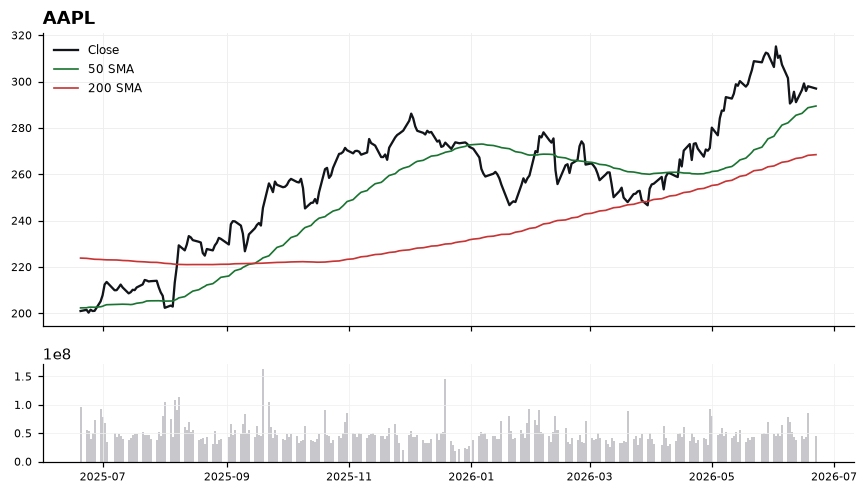
Trend structure remains constructive: price > 50-SMA > 200-SMA defines an intact bullish stack, and the 10.62% cushion over the 200-day signals the broader uptrend is not in jeopardy. However, the bearish MACD cross combined with a neutral RSI near 50 points to short-term momentum exhaustion after the recent advance. The 50-SMA at 289.47 is the line in the sand for dip-buyers, while 297 acts as the pivot — reclaiming momentum above this zone would re-engage the trend, whereas losing 289 opens a deeper mean-reversion toward the 200-SMA. The trade-quality (86.6) and profit-probability (84.0) scores favor the long thesis, but low technical-inflection (29.9) argues for patience on entries.
EntryTiered long: starter on a pullback into 290–292 (just above the 50-SMA), add on a momentum reclaim of 298–300 with MACD turning back toward signal.
InvalidationDaily close below 287 (under the 50-SMA), which would break the near-term trend support and shift bias toward a retest of the 268–270 zone.
Targets306–310 (prior resistance / measured continuation) → 318–322 (extension target on trend resumption)
TimeframeSwing (2-6 weeks)
Inflection21
Probability98
Quality73
ANET is trading at 174.56 within an established uptrend, riding well above both its 50-SMA (159.11) and 200-SMA (142.35), with the AI infrastructure theme keeping a long working bias intact. The setup is at an inflection because price is extended 22.62% above the 200-SMA while RSI at 62.10 still has room before stretching into overbought — the question is whether momentum continues or mean-reverts toward the 50-SMA.
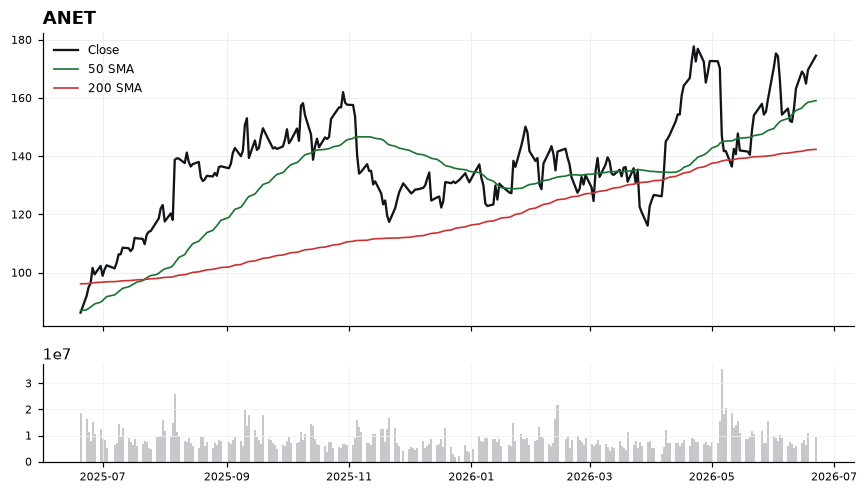
Trend structure is constructive: the 50-SMA (159.11) sits cleanly above the 200-SMA (142.35), confirming a bullish moving-average stack, and price holds a 9.7% buffer over the 50-SMA. MACD at 4.06 versus signal at 2.87 shows a positive and widening spread, indicating momentum is still accelerating rather than rolling over. RSI(14) at 62.10 is firm but not euphoric, leaving headroom before the 70 threshold. The main caution is the 22.62% extension from the 200-SMA, which raises pullback risk into the 159–165 zone on any momentum stall.
EntryPrefer staged entries on weakness rather than chasing strength: initial tranche on a pullback into 168–170, with a second add near the 50-SMA at 159–161. Momentum-trigger alternative: breakout and hold above 176.
InvalidationInvalidation on a daily close below 156, which would breach the 50-SMA (159.11) and break the short-term uptrend structure, shifting odds toward a deeper mean-reversion to the 200-SMA.
TargetsFirst target: 184 — measured continuation extending the current MACD impulse → Second target: 195 — trend extension target if breakout above 176 holds
TimeframeSwing (2-6 weeks)
Ranked by technical inflection, profit-probability, and trade quality. Educational only. Not financial advice.