Price at 400.49 sits beneath both moving averages, with the 50-SMA (402.49) acting as immediate resistance and the 200-SMA (416.96) capping the broader trend. RSI(14) at 47.03 is mid-range — no oversold cushion, no momentum thrust — confirming indecision. MACD at -2.85 versus signal -0.50 shows a 2.35-point negative spread that has yet to inflect, signaling momentum still leans down. The negative 3.95% gap to the 200-SMA is meaningful but not extreme, keeping the inflection two-sided.
Monday Playbook — Top 5 Setups
The day's five highest-conviction setups, ranked by technical inflection, profit-probability, and trade quality — 4 long, 0 short. Trade your plan and manage risk first. Also screened: $TSM, $ORCL, $CRWV, $META, $MRVL, $VRT.
Inflection50
Probability75
Quality91
TSLA is coiling just below its 50-SMA (402.49) and 3.95% under its 200-SMA (416.96), placing price at a decision point between trend repair and continuation lower. With RSI at 47 and MACD negative and widening below signal, the tape is soft enough to warrant a Watch stance rather than chase.
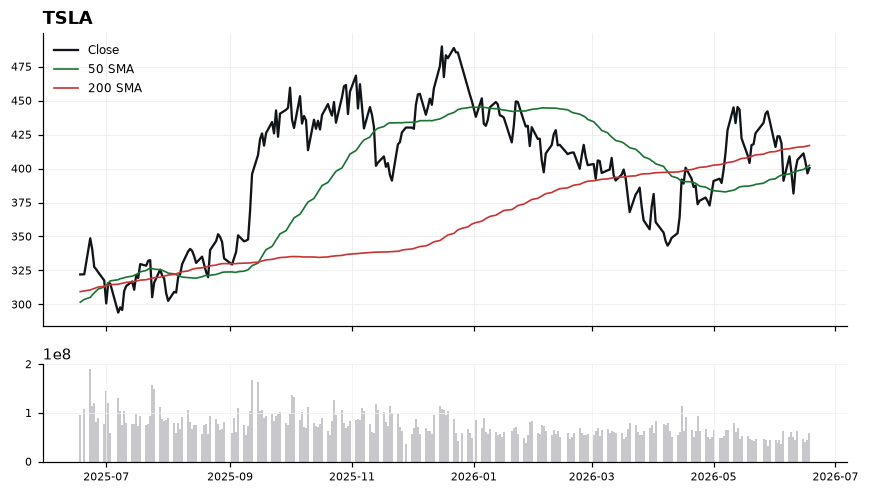
EntryTier 1 trigger: reclaim and hold above the 50-SMA at 402.49 with a close >405 to confirm momentum shift. Tier 2 alternative: dip-and-stabilize entry in the 392-395 zone if MACD histogram begins to compress.
InvalidationInvalidation on a decisive close below 392. Breaking that level voids the base-building thesis and opens a path toward a wider mean-reversion lower, with momentum (MACD) confirming downside follow-through.
TargetsFirst target 416.96 — direct test of the 200-SMA, the key trend arbiter. → Second target 430 — clearance above the 200-SMA signaling trend reclaim.
TimeframeSwing (2-6 weeks)
Inflection49
Probability69
Quality90
AMZN is trading at 244.39, wedged between reclaimed 200-SMA support at 232.80 and overhead 50-SMA resistance at 257.10. With RSI at 44 and MACD (-4.89) still below its signal (-3.48), the setup sits at a tactical inflection where a long bias only activates on confirmation, not anticipation.
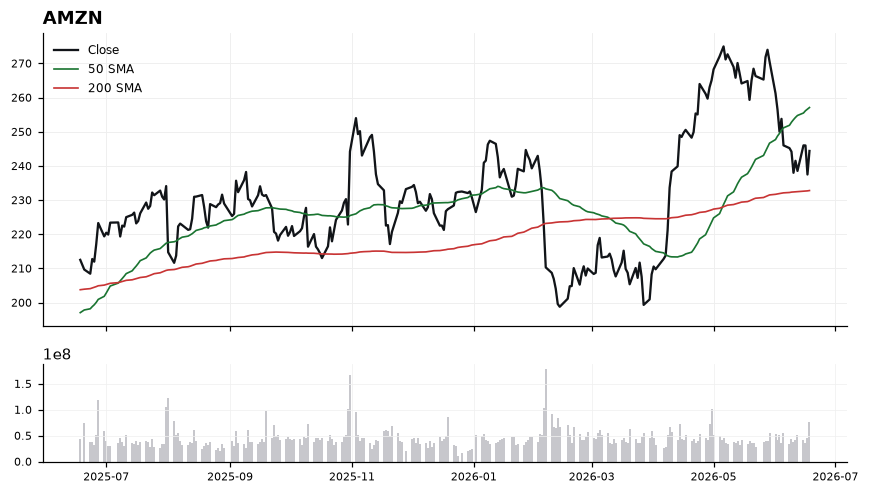
Price holds 4.98% above the rising 200-SMA, preserving the longer-term uptrend structure, but the 50-SMA has rolled into resistance roughly 5% overhead at 257.10. RSI at 44.03 reflects neutral-to-soft momentum with room to expand before overbought conditions, while the negative MACD spread of -1.41 versus signal signals momentum has not yet turned. The 48.9 inflection score corroborates a coiled, undecided tape; however, the 90.3 trade-quality and 69.0 profit-probability scores justify a staged long approach on confirmation.
EntryScale-in zone 240.00–245.00 with adds on a momentum trigger: MACD crossing back above its signal line AND a close above the 50-SMA at 257.10.
InvalidationDaily close below 232.80 (the 200-SMA). A break there invalidates the long-term uptrend reclaim and shifts structure to lower-highs/lower-lows.
Targets257.10 — reclaim of the 50-SMA → 272.00 — measured extension above the 50-SMA toward prior swing supply
TimeframeSwing (2-6 weeks)
Inflection29
Probability84
Quality86
AAPL is consolidating at 298.01 while extended 11.12% above its 200-SMA, with a long bias still intact but momentum decelerating — putting the tape at a decision point between trend continuation and a mean-reversion pullback.
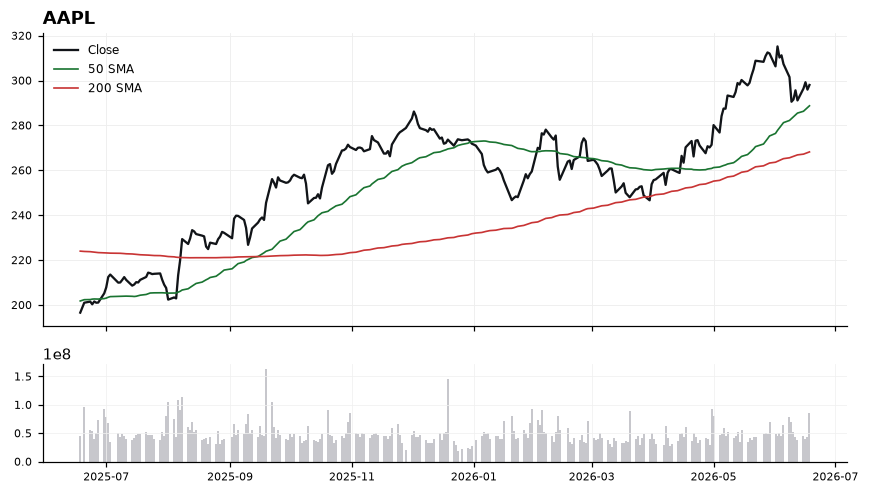
Price holds above both the 50-SMA (288.74) and 200-SMA (268.19), preserving the structural uptrend, but RSI at 50.94 has cooled to neutral and MACD at 1.18 has crossed below its signal at 3.22, signaling fading short-term momentum. The 50-SMA at 288.74 is the first line of defense; a hold there would reassert the trend, while failure opens room toward the 200-SMA. With trade-quality (86.3) and profit-probability (84.0) high but technical-inflection low (28.8), the edge favors patience for a better-located entry rather than chasing 298.
EntryPreferred accumulation zone 289–292 on a pullback toward the 50-SMA (288.74); secondary trigger is a reclaim and close above 300 with MACD curling back toward its signal line.
InvalidationDaily close below 286 invalidates the setup — it would breach the 50-SMA and signal a likely retest of the 268–272 zone around the 200-SMA.
TargetsFirst target 308–312 (recent supply / measured continuation above 300) → Second target 320, extending the trend off the 50-SMA
TimeframeSwing (2-6 weeks)
Inflection24
Probability84
Quality86
NVDA is consolidating just above its rising 50-SMA (209.31) and sits 10.95% above the 200-SMA (189.90), keeping the longer-term uptrend intact while momentum stalls near equilibrium — a classic inflection between trend continuation and a deeper mean-reversion.
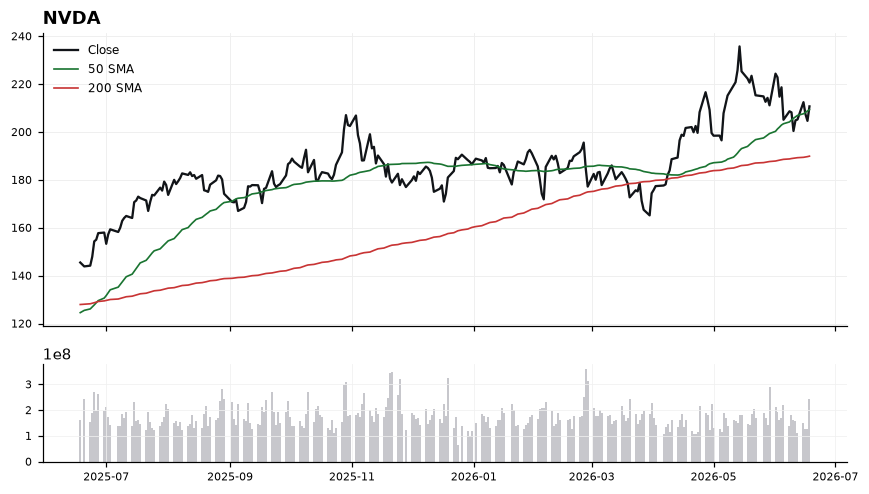
Price at 210.69 is wedged between the 50-SMA (209.31) acting as immediate support and overhead supply, with RSI(14) at 50.37 signaling neutral momentum and no directional conviction. MACD at -1.07 sits below its signal line at -0.11, confirming short-term momentum has rolled over even as the broader structure (price > 50 > 200) remains constructive. The wide 10.95% cushion to the 200-SMA suggests trend support is distant, so the 50-SMA becomes the critical line in the sand for the working long bias.
EntryStage longs on a reclaim and hold above 211.50 (post-MACD-cross confirmation) or on a controlled pullback into the 208.50–209.50 zone where the 50-SMA offers first support.
InvalidationClosing break below 206.00 invalidates the setup — it would mean loss of the 50-SMA as support and open a path toward the 200-SMA at 189.90.
TargetsFirst target 218.00 (recovery of recent supply shelf) → Second target 225.00 (trend extension objective)
TimeframeSwing (2-6 weeks)
Inflection18
Probability98
Quality75
ANET sits at 169.67 within an established uptrend, trading above both its rising 50-SMA (158.53) and 200-SMA (142.17), with the AI infrastructure theme providing the structural backdrop. The inflection question is whether the current MACD-positive, mid-RSI configuration can extend the trend or stalls given the stretched 19.34% distance to the 200-SMA.
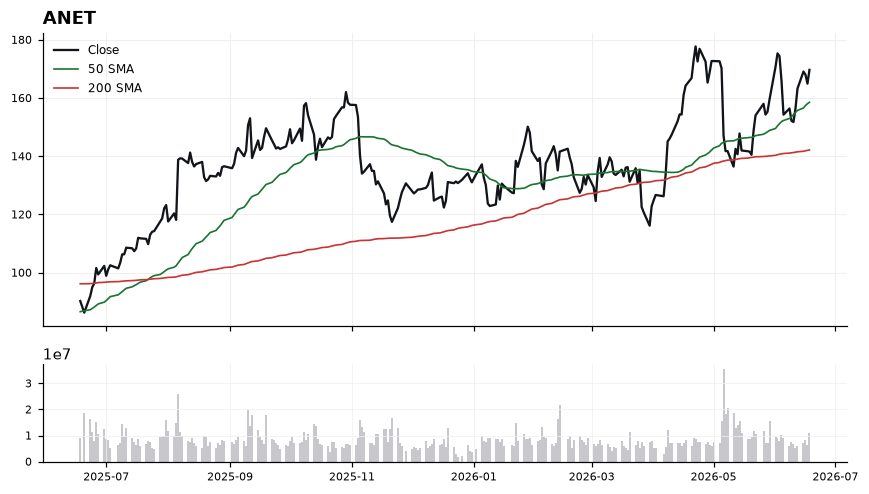
Trend structure is constructive: price > 50-SMA > 200-SMA in classic stacked alignment, and MACD at 3.38 above its 2.57 signal confirms positive momentum without yet being exhausted. RSI at 58.89 is firm but well below the 70 overbought line, leaving room to extend before momentum signals strain. The caveat is the 19.34% extension above the 200-SMA, which raises mean-reversion risk, while the 50-SMA at 158.53 stands as the first meaningful trend-defining support.
EntryPreferred accumulation zone 162.00–165.00 on a pullback toward the rising 50-SMA at 158.53; alternative momentum trigger on a daily close above 172.50 reclaiming recent highs.
InvalidationDaily close below 157.50, just under the 50-SMA. A break there would compromise the intermediate uptrend structure and shift bias toward a deeper retest of the 142.17 200-SMA.
TargetsFirst target 178.00–180.00, prior resistance and a measured extension from the 50-SMA base → Second target 188.00–190.00 as a trend-extension objective if MACD momentum persists and RSI clears 65
TimeframeSwing (2-6 weeks)
Ranked by technical inflection, profit-probability, and trade quality. Educational only. Not financial advice.