Price at 400.49 sits fractionally beneath the 50-SMA (402.49), framing it as immediate resistance, while the falling 200-SMA at 416.96 caps the broader trend. RSI at 47 is neutral but tilted soft, and MACD at -2.85 versus signal -0.50 signals expanding downside momentum that has yet to flush. The -3.95% gap to the 200-SMA combined with a high trade-quality score (91) but middling inflection (50) argues for patience until price proves direction across the 402-417 band.
Sunday Playbook — Top 5 Setups
The day's five highest-conviction setups, ranked by technical inflection, profit-probability, and trade quality — 4 long, 0 short. Trade your plan and manage risk first. Also screened: $TSM, $ORCL, $CRWV, $META, $MRVL, $VRT.
Inflection50
Probability75
Quality91
TSLA is coiling just below its 50-SMA (402.49) and ~4% under its 200-SMA (416.96), pressing a key decision zone where reclaiming trend or losing it could resolve a multi-week range.
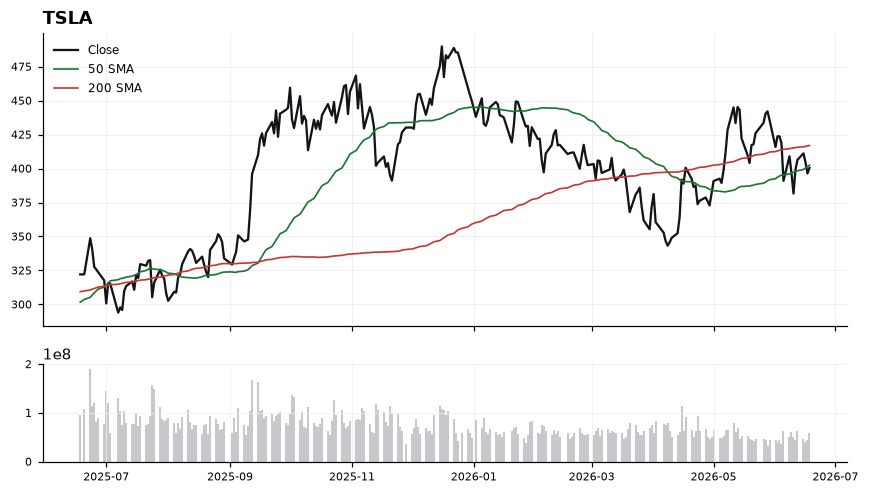
EntryStalk a reclaim of 402.49 (50-SMA) with follow-through above 405 as a momentum trigger; alternatively, a pullback toward 392-395 that holds with RSI stabilizing offers a lower-risk re-entry.
InvalidationA decisive close below 390 invalidates the setup, signaling MACD-led breakdown continuation and opening the structural air pocket beneath the range.
TargetsFirst target 416.96 — the 200-SMA, where trend resistance and prior supply align → Second target 428-432 — extension zone on a clean 200-SMA reclaim and MACD bullish cross
TimeframeSwing (2-6 weeks)
Inflection49
Probability69
Quality90
AMZN is consolidating between its rising 200-SMA (232.80) and declining 50-SMA (257.10), with price at 244.39 sitting roughly in the middle of that compression zone. With trade-quality scoring 90.3 and profit-probability 69.0 against a neutral RSI of 44, the setup is at an inflection where the next directional resolution likely defines the swing.
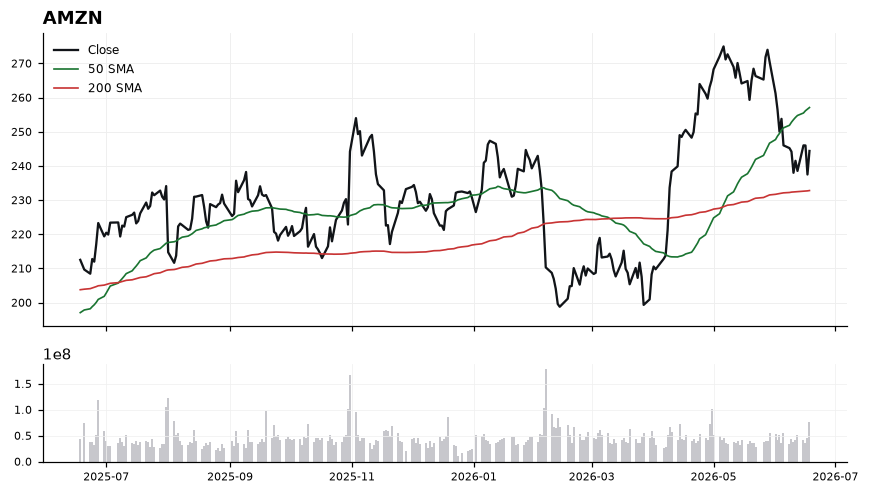
Price is 4.98% above the 200-SMA, preserving the longer-term uptrend structure, but trades 4.9% below the 50-SMA (257.10), which now acts as immediate overhead resistance. RSI at 44 is mid-range and not yet oversold, signaling momentum is soft but has room to rebuild before any squeeze. MACD at -4.89 below its signal at -3.48 confirms momentum remains negative and has not yet crossed, so any long thesis is anticipatory rather than confirmed. The 232.80 200-SMA is the key trend line whose hold or break dictates whether this is a pullback or a regime change.
EntryStagger entries on a constructive pullback into 238–242 with confirmation, or on a momentum trigger via reclaim of 248 with MACD crossing up through its signal; avoid chasing into the 257.10 50-SMA resistance.
InvalidationClosing break below 232.80 (the 200-SMA) invalidates the long bias — it would flip the medium-term trend reference and turn the prior support shelf into resistance.
TargetsFirst target: 257.10 (50-SMA) — reclaim attempt and gap-fill of the compression range. → Second target: 265–268 zone on a clean 50-SMA breakout, extending the move beyond the current resistance band.
TimeframeSwing (2-6 weeks)
Inflection29
Probability84
Quality86
AAPL is grinding higher within an established uptrend, trading at 298.01 — about 11.12% above the 200-SMA and holding above the 50-SMA at 288.74. The setup is at an inflection because RSI has cooled to a neutral 50.94 and MACD (1.18) has crossed below its signal (3.22), signaling near-term momentum loss inside a longer-term bullish structure.
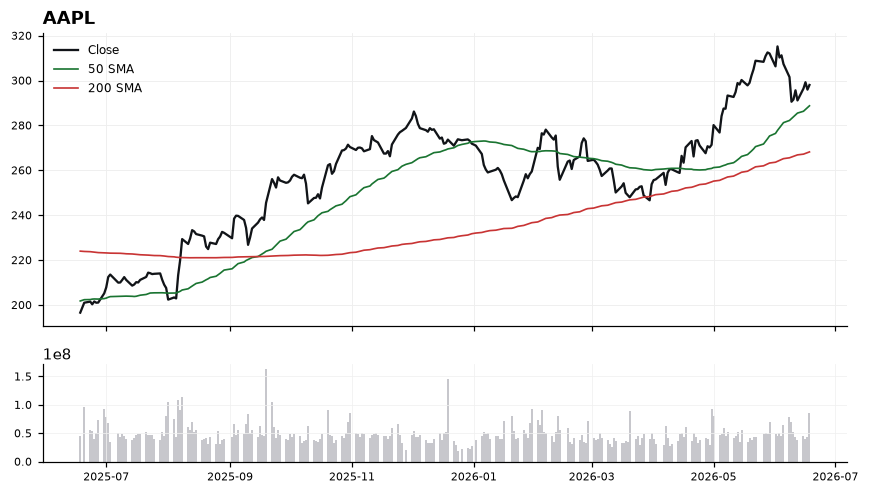
Price remains above both the rising 50-SMA (288.74) and 200-SMA (268.19), confirming the broader uptrend supports a long bias. However, the MACD bearish cross with signal well above the MACD line (3.22 vs 1.18) and RSI mid-range at 50.94 suggest momentum has rolled over and a pullback toward the 50-SMA is in play. The 50-SMA at 288.74 becomes the first key reaction zone, while loss of that shelf would expose the gap down toward the 200-SMA at 268.19. Trade-quality (86.3) and profit-probability (84.0) are constructive, but the low technical-inflection score (28.8) argues for patience rather than chasing strength at 298.
EntryStagger longs into pullbacks: initial tranche 291.00–293.00, with a larger add into the 50-SMA zone at 287.00–289.00. Avoid chasing above 300 until MACD recrosses above its signal.
InvalidationDaily close below 282.00 (under the 50-SMA). A break there signals momentum failure and opens a path toward the 200-SMA at 268.19, invalidating the swing long thesis.
TargetsT1: 305.00 — retest of recent highs and round-number resistance → T2: 314.00 — measured extension above range, trail stops to 295.00
TimeframeSwing (2-6 weeks)
Inflection24
Probability84
Quality86
NVDA is coiling just above its 50-SMA (209.31) and 10.95% above its rising 200-SMA (189.90), forming a tight inflection point where a flat RSI of 50.37 meets a bearish MACD cross (-1.07 vs -0.11 signal). The working long bias hinges on whether the 50-SMA shelf holds as momentum decelerates near 210.
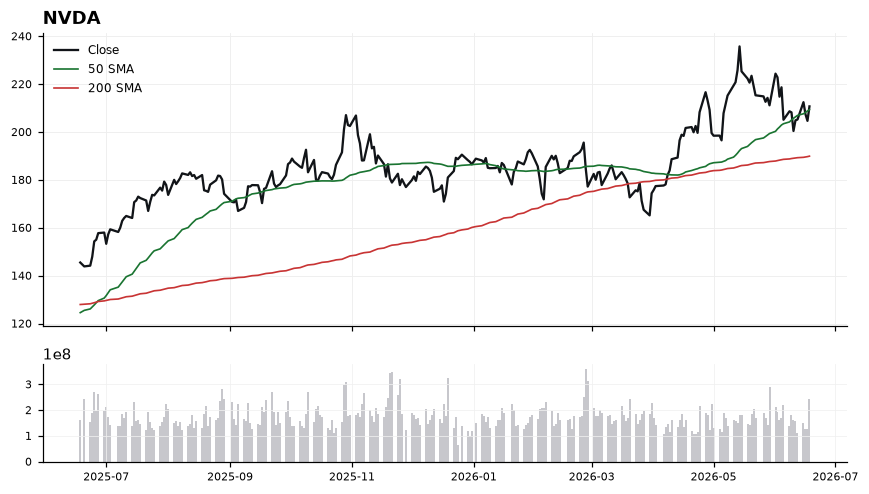
Price at 210.69 is essentially pinned to the 50-SMA at 209.31, signaling a balance zone rather than trend continuation. RSI at 50.37 is mid-range neutral, offering no directional edge, while MACD below signal (-1.07 vs -0.11) flags short-term momentum erosion that has yet to break structure. The 10.95% cushion above the 200-SMA (189.90) keeps the broader uptrend intact, but the gap also leaves room for mean reversion before a higher-conviction long re-engages. With trade-quality at 86.4 but technical-inflection at just 24.0, the setup favors patience over chase.
EntryTiered: initial probe on a reclaim and hold above 212.50 (clears current congestion), with a preferred add-zone on a pullback to the 207–209 shelf where the 50-SMA (209.31) acts as dynamic support.
InvalidationDaily close below 204.50 invalidates the 50-SMA shelf and opens a path toward the 200-SMA; breaking it signals momentum has shifted from consolidation to distribution.
TargetsFirst target 218.00 — reclaim of recent local highs and MACD reset toward signal line → Second target 225.50 — trend-extension objective if RSI pushes back above 60
TimeframeSwing (2-6 weeks)
Inflection18
Probability98
Quality75
ANET is riding an AI-infrastructure uptrend with price at 169.67, holding above both the 50-SMA (158.53) and 200-SMA (142.17). The setup is at a tactical inflection because the stock is already 19.34% extended above its 200-day, leaving room for either a continuation push or a mean-revert pullback to the rising 50-day.
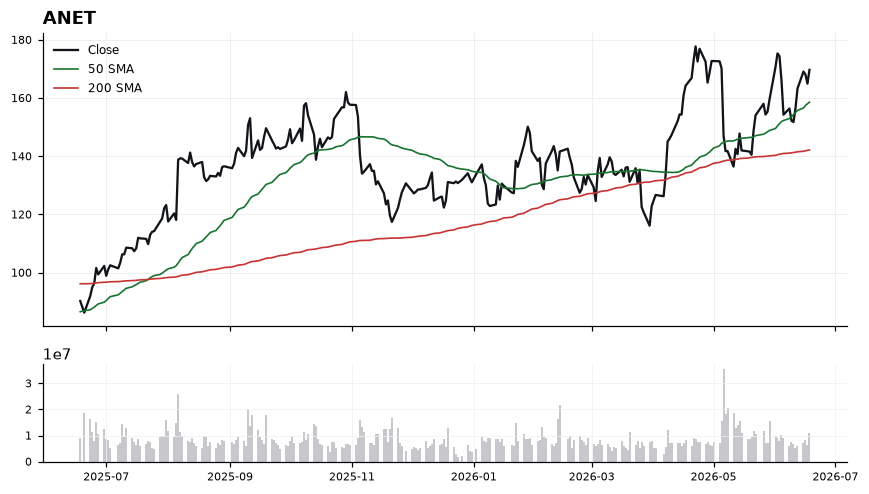
Trend structure is constructive: price > 50-SMA > 200-SMA, with the 50-day acting as dynamic support roughly 11.14 points below spot. RSI(14) at 58.89 is firm but not overbought, leaving headroom before the 70 line. MACD at 3.38 sits above its signal at 2.57, confirming positive momentum, though the 19.34% gap to the 200-SMA flags stretched conditions that argue for disciplined entries rather than chase.
EntryPreferred accumulation zone 162.00-165.00 on a controlled pullback toward the 50-SMA at 158.53; alternatively, a momentum trigger on a daily close above 172.50 to confirm continuation.
InvalidationInvalidation on a daily close below 156.00, which would break the 50-SMA (158.53) and signal loss of the intermediate uptrend, putting the 200-SMA at 142.17 back in play.
TargetsFirst target 178.00 (recent momentum extension and round-number resistance) → Second target 188.00 (measured continuation projecting from the 50/200-SMA structure)
TimeframeSwing (2-6 weeks)
Ranked by technical inflection, profit-probability, and trade quality. Educational only. Not financial advice.