AMAT vs LRCX
Side by side
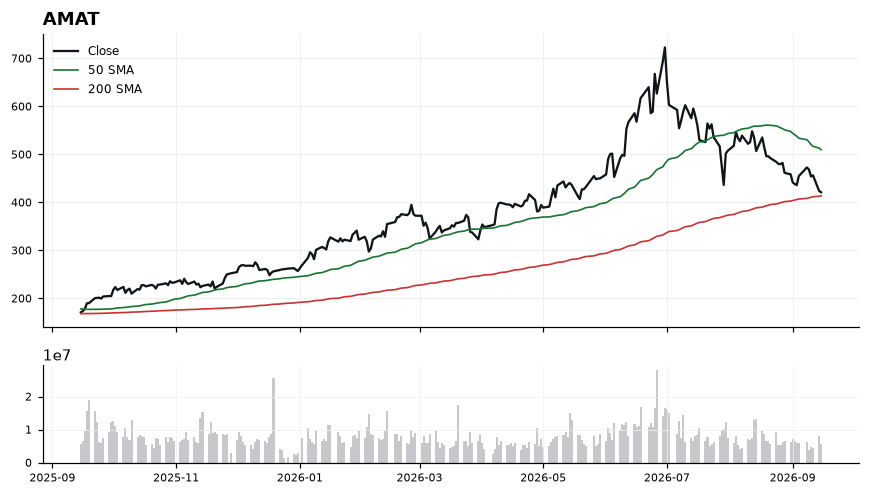
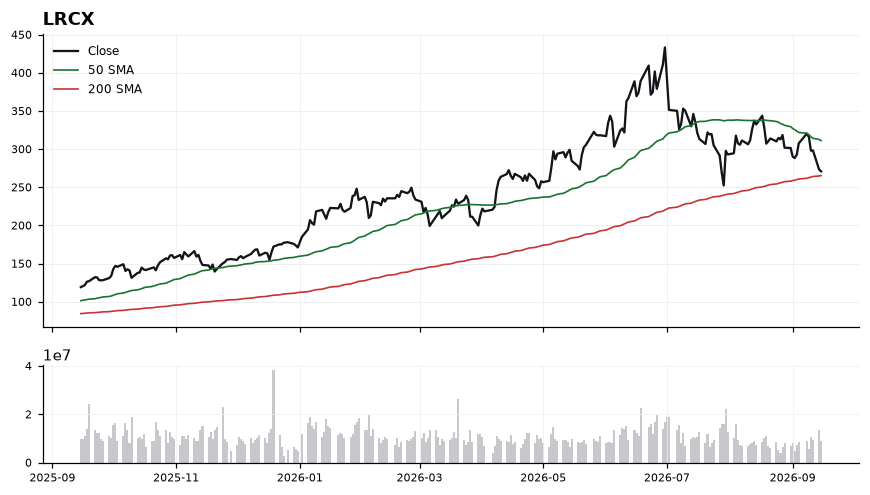
| Metric | $AMAT | $LRCX |
|---|---|---|
| Price | 421.17 | 270.87 |
| 50-day SMA | 509.84 | 311.10 |
| 200-day SMA | 413.66 | 265.40 |
| Dist. to 200-day | +1.80% | +2.10% |
| RSI (14) | 34.10 | 36.50 |
| MACD | -21.58 | -8.09 |
Higher distance to the 200-day = stronger long-term trend (highlighted).
$AMATLong
$LRCXLong
The read
$AMAT is showing a mild uptrend (+1.8% vs its 200-day), while $LRCX is showing a mild uptrend (+2.1%). On the longer-term trend measure, $LRCX has the stronger relative position. The latest Daily Playbook reads $AMAT as Long and $LRCX as Long.
Educational only. Not financial advice. Technicals are end-of-day · as of Sep 15, 2026.