Price at 344.08 is effectively pinned to the 50-SMA, with the broader uptrend intact given the 50 > 200-SMA alignment. RSI at 50.12 is dead-neutral, signaling momentum reset rather than exhaustion, while MACD at -0.23 is still below zero but above its signal line (-0.29) — an early curl that often precedes a trend-continuation push. The thin 1.62% cushion to the 200-SMA keeps risk defined and the setup binary.
Thursday Playbook — Top 5 Setups
The day's five highest-conviction setups, ranked by technical inflection, profit-probability, and trade quality — 5 long, 0 short. Trade your plan and manage risk first. Also screened: $HIMS, $ASAN, $MDB, $AMZN, $QQQ, $AFRM.
Inflection61
Probability98
Quality87
GOOGL is coiling right on top of its rising 50-SMA (343.93) and sitting just 1.62% above the 200-SMA (338.60), a classic inflection where a MAG7 long bias either resumes or fails cleanly.
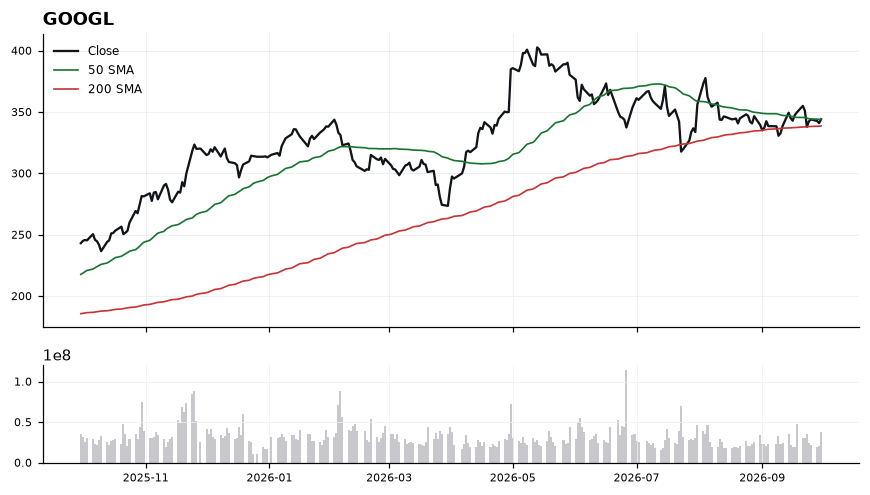
EntryConsider staged entries on strength above 345.00 (reclaim of recent balance) with add-on confirmation over 348.50; alternatively, pullback entries into the 340–343.90 shelf where the 50-SMA offers structural support.
InvalidationDaily close below 338.60 (200-SMA) invalidates the long thesis, as it would break the trend structure and flip the medium-term bias neutral-to-down.
Targets352.00 — reclaim of near-term supply and prior consolidation highs → 360.00 — measured extension if MACD crosses positive and RSI pushes above 60
TimeframeSwing (2-6 weeks)
Inflection58
Probability98
Quality79
GLW is coiling just above both its 50-SMA (152.66) and 200-SMA (149.77) at 153.76, with MACD (-0.14 vs signal -0.64) curling higher — a potential inflection where a reclaim attempt is underway but RSI at 49 shows momentum is still undecided.
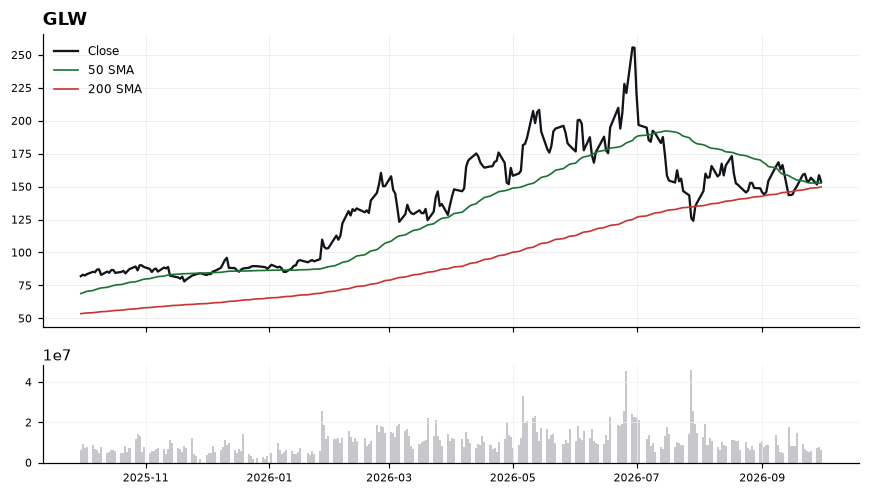
Price sits only 2.67% above the 200-day, keeping the longer-term trend structurally intact while the 50-day has crossed above the 200-day, a constructive backdrop. MACD remains negative in absolute terms but the gap to signal has narrowed sharply, suggesting downside momentum is fading. RSI at 49.25 is squarely neutral, leaving room to expand in either direction without being overbought. The confluence of 50/200-SMA just below current price creates a well-defined support shelf between 149.77 and 152.66.
EntryPreferred accumulation zone 152.66–153.00 on a pullback to the 50-SMA; alternatively, a momentum trigger on a decisive close above 155.00 confirms breakout from the coil.
InvalidationDaily close below 149.77 (200-SMA) invalidates the long bias, signaling loss of the longer-term trend support and failure of the 50/200 confluence.
TargetsFirst target 158.50 — recovery of prior swing resistance and MACD cross confirmation zone → Second target 162.50 — measured move extension above the 50/200 confluence base
TimeframeSwing (2-6 weeks)
Inflection65
Probability83
Quality86
IONQ has reclaimed its 200-SMA (43.50) with price at 43.86, flipping a prior ceiling into potential support while the 50-SMA (40.22) curls up beneath — a classic trend-regain inflection with trade-quality scored 86.1.
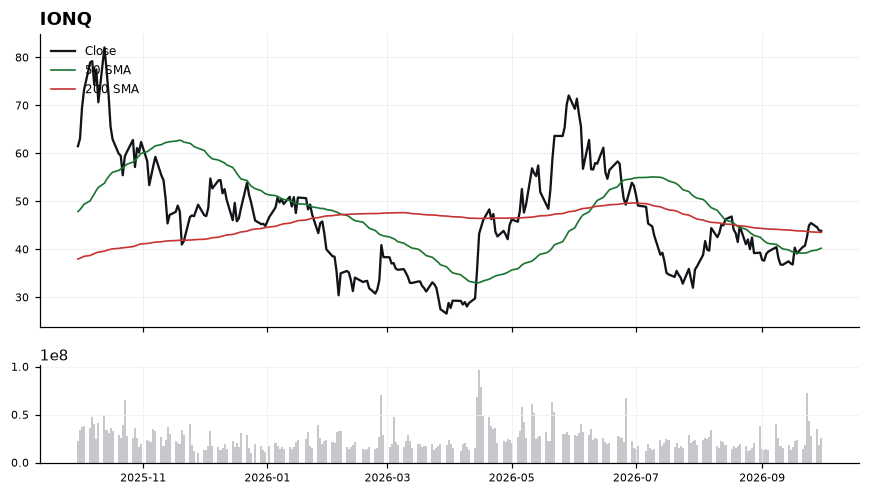
Price sits just 0.82% above the 200-SMA, the thinnest possible margin that defines the make-or-break zone. RSI at 57.89 shows constructive momentum without being overbought, leaving room to extend. MACD at 1.00 over a 0.30 signal line confirms a bullish momentum crossover with widening separation. The 50-SMA at 40.22 provides a well-defined trend-support shelf roughly 8% below spot.
EntryPrefer entries on a hold above the 200-SMA: 43.50-44.00 pullback zone, or a confirmed breakout trigger above 44.50 on expanding momentum.
InvalidationInvalidation on a daily close below 42.80; losing that voids the 200-SMA reclaim and would reopen downside toward the 50-SMA.
TargetsFirst target 47.00 (measured extension from the 200-SMA reclaim) → Second target 50.50 (prior swing resistance / round-number magnet)
TimeframeSwing (2-6 weeks)
Inflection74
Probability64
Quality86
IWM is sitting just 0.67% above its rising 200-SMA (276.05) after pulling back from the 50-SMA (293.08), with RSI(14) at 29.67 flagging an oversold condition at a structurally important level. This confluence of a long-term trend line and washed-out momentum defines the inflection.
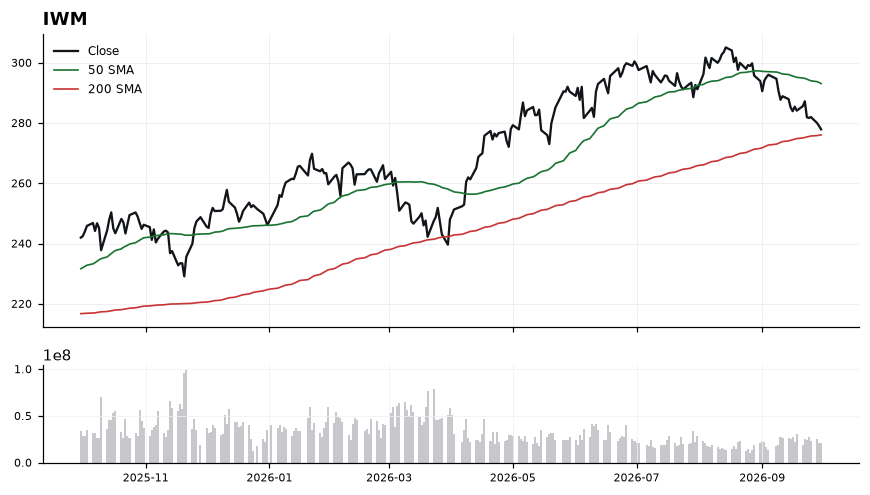
Price at 277.89 has broken below the 50-SMA and is now testing the 200-SMA, which has historically acted as a dynamic trend floor. RSI at 29.67 is in oversold territory, raising the probability of a mean-reversion bounce, though MACD at -4.23 remains below its signal line (-3.60), confirming downside momentum has not yet turned. The 200-SMA at 276.05 is the pivotal battleground: holding it preserves the longer-term uptrend structure, while the ~15-point gap to the 50-SMA defines the upside reversion runway.
EntryScale into the 276.00–278.00 zone on signs of stabilization at the 200-SMA; a reclaim and 1h/daily close back above 280.00 would add confirmation.
InvalidationDaily close below 273.00 (roughly 1% under the 200-SMA). Breaking that invalidates the 200-SMA support thesis and signals a trend-structure failure, likely accelerating downside.
TargetsFirst target 286.00 — midpoint between current price and the 50-SMA, prior consolidation shelf → Second target 293.00 — tag of the 50-SMA where sellers are likely to re-engage
TimeframeSwing (2-6 weeks)
Inflection68
Probability69
Quality81
COIN is pressing right against its 200-day SMA (186.14) with price at 186.41, a classic trend-reclaim inflection where the 50-SMA (171.94) has already turned up beneath spot.
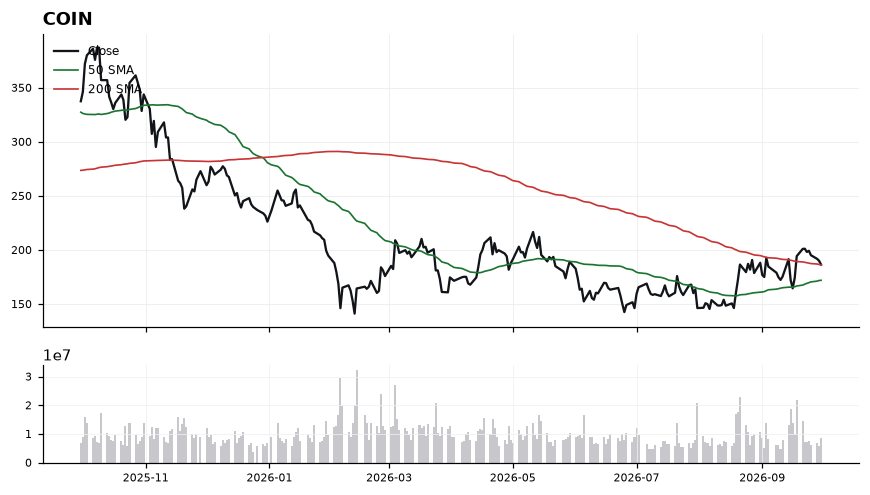
Price sits just 0.15% above the 200-day, so this level is the pivotal line in the sand for the longer-term trend. RSI at 51.73 is neutral-constructive, showing momentum has shifted out of bearish territory without being overbought. MACD at 5.67 is still positive but has crossed below its signal (6.14), hinting at near-term momentum cooling even as the broader structure (price > 50-SMA > rising toward 200-SMA alignment) remains supportive. Scores (trade-quality 80.5, profit-probability 69.0) corroborate a quality long setup pending confirmation.
EntryPreferred accumulation zone 182.00–186.50 on a hold of the 200-SMA; add-on trigger on a decisive close above 190.00 to confirm reclaim.
InvalidationDaily close below 171.90 (loss of the 50-SMA) invalidates the long thesis and signals the inflection has failed back into the prior downtrend.
TargetsFirst target 202.00 (recent supply shelf above the 200-SMA reclaim) → Second target 215.00 (measured extension once momentum re-expands)
TimeframeSwing (2-6 weeks)
Ranked by technical inflection, profit-probability, and trade quality. Educational only. Not financial advice.