Price is pinned below the 50-SMA (343.99) but holding above the rising 200-SMA (338.44), framing a tight 1.6% decision range. RSI at 47.36 is neutral with a slight downside lean, while MACD at -0.29 has just crossed fractionally above its signal line (-0.30), hinting at waning downside momentum. The technical-inflection score of 66.3 and trade-quality of 87.5 reinforce that the risk/reward geometry is favorable, but confirmation above the 50-SMA is still required to validate the long bias.
Wednesday Playbook — Top 5 Setups
The day's five highest-conviction setups, ranked by technical inflection, profit-probability, and trade quality — 5 long, 0 short. Trade your plan and manage risk first. Also screened: $HIMS, $SPY, $AMZN, $QCOM, $QQQ, $AFRM.
Inflection66
Probability83
Quality88
GOOGL is coiling between its 50-SMA (343.99) and 200-SMA (338.44) at 340.92, sitting just 0.73% above the long-term trend line — a classic inflection zone where the next directional break typically sets the tone for the following weeks.
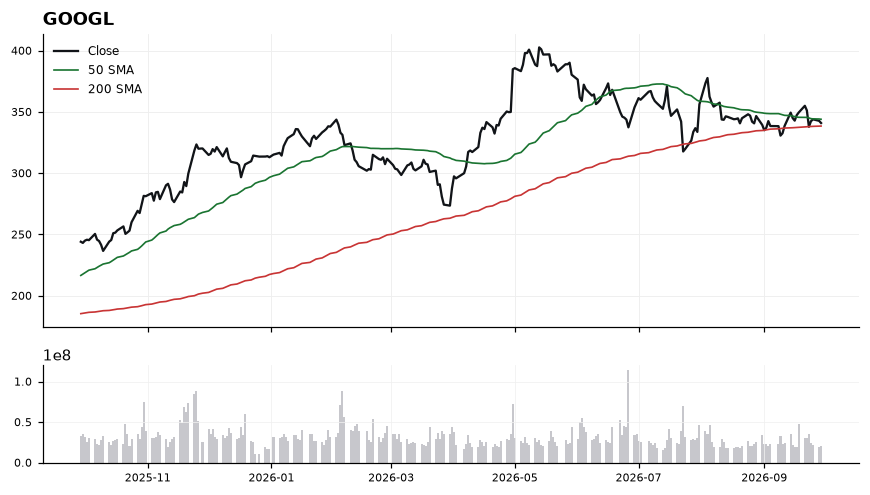
EntryTiered: starter long on a reclaim and 1h close above 344.00 (50-SMA breakout); add on pullback retest of 338.50–340.00 that holds the 200-SMA.
InvalidationDaily close below 336.00 — this breaks the 200-SMA (338.44) with a buffer, invalidating the long thesis and flipping structure to lower-highs.
TargetsFirst: 350.00–352.00 (prior supply zone above the 50-SMA) → Second: 358.00–360.00 (measured extension if momentum confirms with MACD cross-up)
TimeframeSwing (2-4 weeks)
Inflection65
Probability83
Quality86
IONQ is coiling just above its 200-SMA (43.55) after reclaiming the 50-SMA (40.05), putting price at an inflection where a confirmed hold flips the long-term trend bias constructive. With price only 0.84% above the 200-day, the next directional expansion typically defines the next multi-week leg.
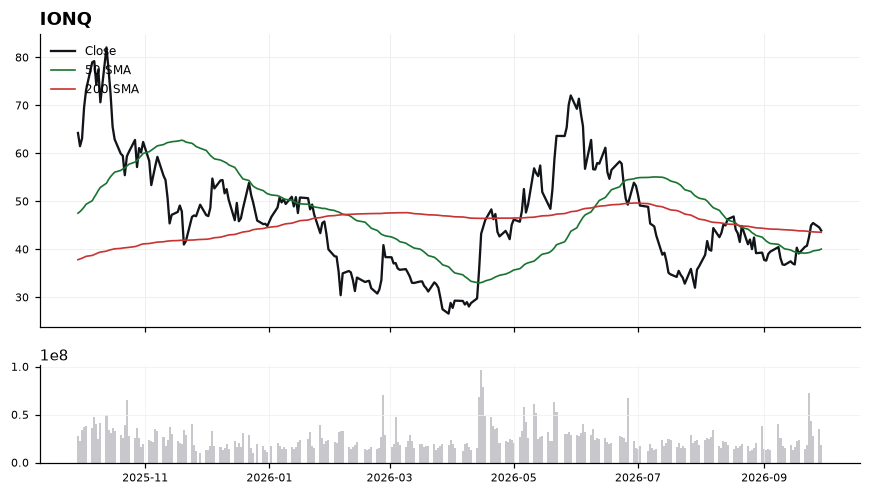
Price at 43.91 sits above both the 50-SMA (40.05) and 200-SMA (43.55), with the shorter average trending below the longer — a classic early-stage recovery structure rather than a mature uptrend. RSI at 58.06 shows positive momentum without being overbought, leaving room to extend. MACD at 0.93 versus signal 0.12 confirms a widening bullish momentum spread, supporting the working long bias. The thin 0.84% cushion to the 200-SMA, however, keeps the setup tactically fragile until price distances itself from that pivot.
EntryPreferred entry on a pullback into the 43.00–43.55 zone that holds the 200-SMA; alternative momentum trigger on a decisive close above 44.50 to confirm breakout from the inflection shelf.
InvalidationInvalidation on a daily close below 40.05 (50-SMA); breaking it would negate the reclaim, flip MACD risk lower, and void the long thesis.
TargetsFirst target 47.50 — prior swing resistance and measured extension from the 200-SMA reclaim. → Second target 51.00 — next structural level if momentum (RSI >65) expands.
TimeframeSwing (2-6 weeks)
Inflection48
Probability98
Quality83
GLW is grinding higher at 158.71, holding above both the 50-SMA (152.83) and 200-SMA (149.48) with MACD curling up (-0.08 vs -0.77 signal), marking a potential inflection as momentum turns while RSI (53.12) still has room to run.
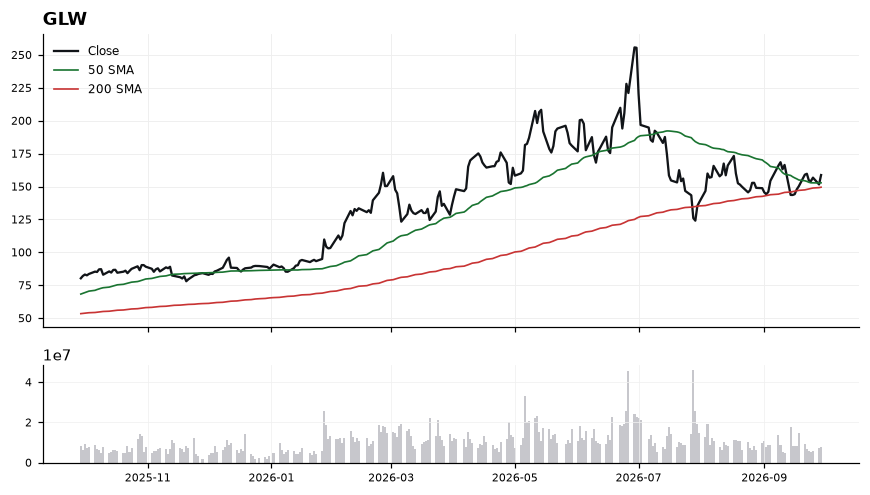
Price sits 3.85% above the rising 50-SMA and 6.18% above the 200-SMA, confirming the broader trend structure remains constructive. The MACD cross-up from deeply negative territory suggests downside momentum has exhausted, though RSI at 53 is only mid-range, indicating neither overbought risk nor decisive breakout thrust. The 50-SMA at 152.83 is the key dynamic support, with the 200-SMA at 149.48 as the structural line that defines the long thesis. Trade-quality (82.5) and profit-probability (98.0) are high, but technical-inflection (47.6) argues for staged entries rather than chasing.
EntryPreferred accumulation 153.00–155.50 on pullback to the 50-SMA; secondary trigger on strength above 160.00 confirming breakout continuation.
InvalidationDaily close below 149.00 (just under the 200-SMA at 149.48) invalidates the long bias and signals trend regime change.
TargetsFirst target 164.50 (recent swing resistance zone) → Second target 170.00 (measured extension above the 50/200-SMA stack)
TimeframeSwing (2-6 weeks)
Inflection72
Probability64
Quality86
IWM is testing its 200-SMA zone (275.95) after pulling back from the 50-SMA at 293.46, with price now just 1.11% above the long-term trend line and RSI at 31 flagging an oversold inflection.
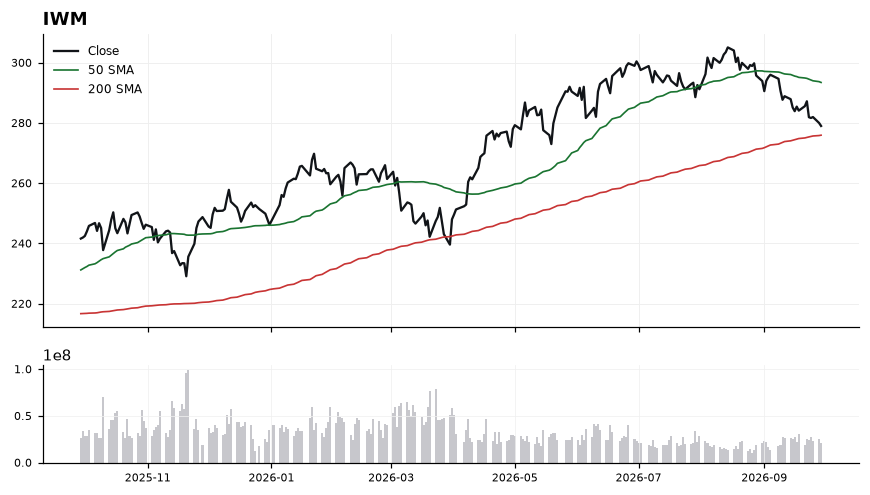
Price at 279.01 sits in a tight 3-point band above the 200-SMA (275.95), the primary line in the sand that has defined the broader uptrend. RSI(14) at 31.05 is at the threshold of oversold, often where mean-reversion attempts begin, but MACD at -4.05 under its signal (-3.44) and still widening confirms downside momentum has not yet turned. The gap up to the 50-SMA (293.46) measures roughly 5.2% of overhead supply, so any bounce faces a defined ceiling.
EntryStagger entries in the 276.00–279.00 reclaim zone, with confirmation on a daily close back above 280.00 and MACD histogram beginning to compress toward its signal line.
InvalidationDaily close below 274.50 (under the 200-SMA) invalidates the long thesis — losing the 200-day shifts structure from pullback-in-uptrend to trend break.
Targets286.50 — mid-range reversion between current price and the 50-SMA → 293.46 — retest of the 50-SMA, the key overhead resistance
TimeframeSwing (2-6 weeks)
Inflection58
Probability83
Quality79
COIN is holding above both its 50-SMA (171.72) and 200-SMA (186.55), with price at 190.02 just 1.86% above the long-term trend line — a classic reclaim-and-retest zone where the next directional push is often decided.
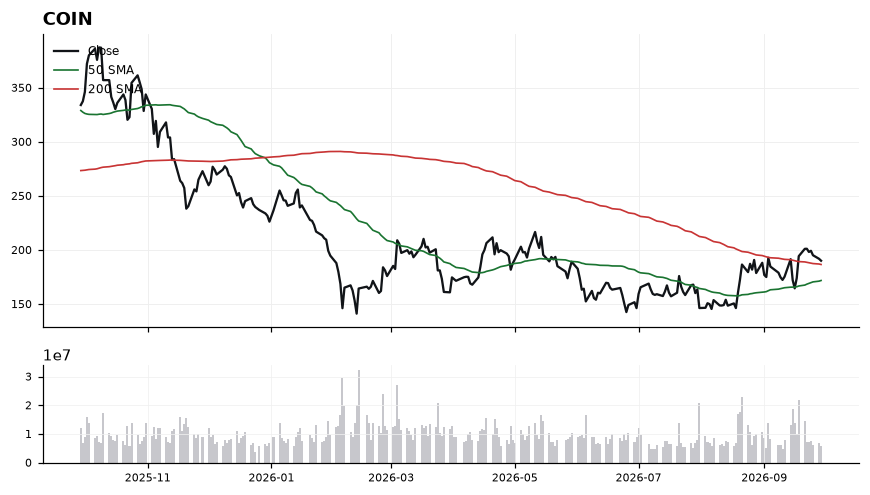
The 50-SMA has crossed above the 200-SMA, confirming a bullish structural backdrop, while price trades above both averages. RSI at 53.91 is constructive but not stretched, leaving room to extend before overbought conditions emerge. MACD at 6.45 remains above its 6.26 signal line, though the narrow spread suggests momentum is positive but decelerating. The thin 1.86% cushion over the 200-SMA makes 186.55 the pivotal line in the sand for the bull case.
EntryPreferred entry on a controlled pullback into 186.55–188.50 (the 200-SMA retest zone), or on a momentum trigger above 192.50 that reasserts upside with MACD expansion.
InvalidationInvalidation on a daily close below 184.00; losing the 200-SMA (186.55) with follow-through would neutralize the reclaim thesis and expose the 50-SMA at 171.72.
TargetsFirst target 200.00–203.00 (round-number resistance and prior supply) → Second target 212.00–215.00 on continuation with MACD re-expansion
TimeframeSwing (2-6 weeks)
Ranked by technical inflection, profit-probability, and trade quality. Educational only. Not financial advice.