Structurally, the stacking of price > 50-SMA > 200-SMA confirms an intact uptrend, and the 3.57% cushion to the 200-SMA argues the trend has room before mean-reversion risk builds. The MACD histogram improving from deeply negative toward the zero line signals momentum inflecting positively, while RSI at 54.99 is neither overbought nor stalling — leaving runway for continuation. The 50-SMA at 345.58 is the immediate line-in-the-sand for bulls, with the 200-SMA at 337.50 as the deeper structural floor. Trade-quality (91.2) and profit-probability (98.0) scores reinforce a favorable risk/reward profile at these levels.
Monday Playbook — Top 5 Setups
The day's five highest-conviction setups, ranked by technical inflection, profit-probability, and trade quality — 5 long, 0 short. Trade your plan and manage risk first. Also screened: $AAOI, $META, $COIN, $QQQ, $SHOP, $GLW.
Inflection58
Probability98
Quality91
GOOGL is grinding higher within a constructive MAG7 uptrend, trading at 349.54 — just above both its 50-SMA (345.58) and 200-SMA (337.50). With MACD (-0.32) crossing above its signal (-1.87) and RSI at a neutral-bullish 54.99, price sits at an inflection where the trend is re-asserting without yet being extended.
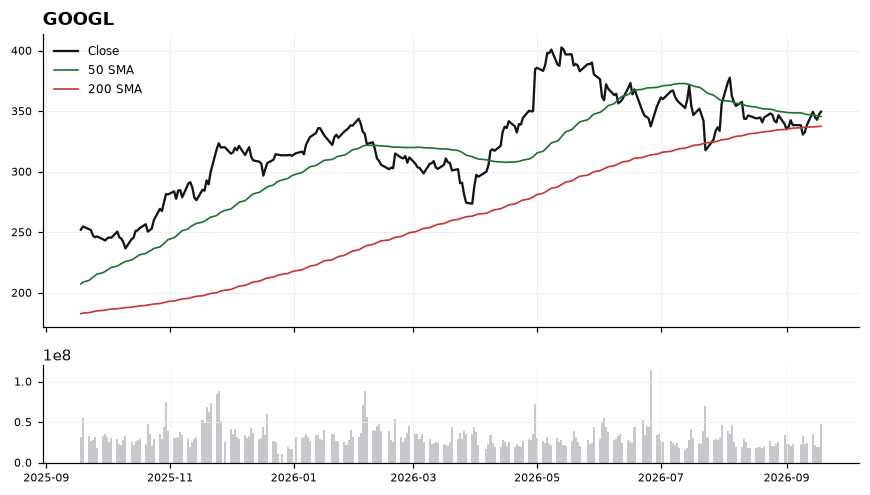
EntryPreferred accumulation zone 345.58–347.50 (pullback into the 50-SMA); confirmation add on a reclaim/hold above 350.00 with MACD crossing above zero.
InvalidationDaily close below 337.50 (the 200-SMA). A break there would invalidate the trend-continuation thesis and flip structure to neutral/negative.
TargetsFirst target 358.00 — measured continuation from the 50-SMA base → Second target 365.00–368.00 — extension zone as momentum broadens
TimeframeSwing (2–6 weeks)
Inflection70
Probability83
Quality87
HIMS is coiling directly on its 200-day SMA (27.98) with price at 27.99, a classic decision point where the long-term trend line meets a fading downside momentum impulse. Trade-quality (86.6) and profit-probability (83.0) scores flag this as a high-grade inflection setup for a tactical long.
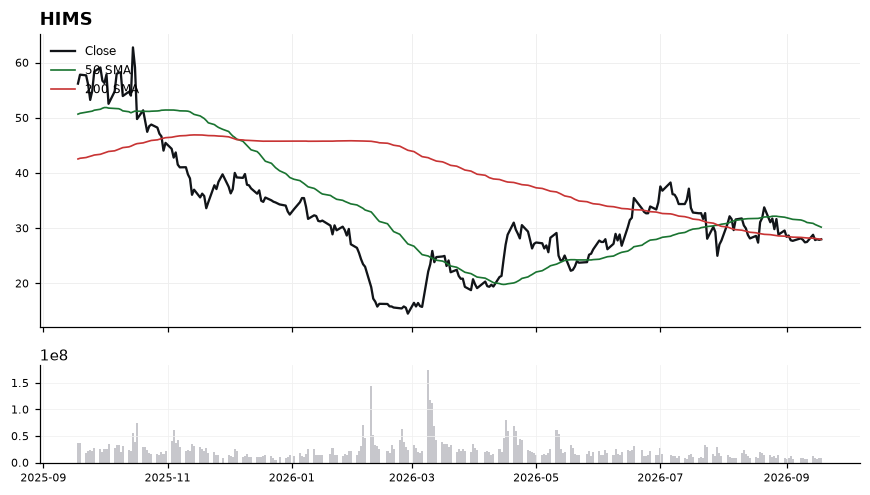
Price sits 0.03% from the 200-SMA, effectively pinned to the line that has defined the multi-quarter trend, while the 50-SMA at 30.19 caps upside as near-term resistance. RSI at 45.59 is neutral-to-soft but no longer oversold, and MACD (-0.69) has just crossed marginally above its signal (-0.70), hinting at a stall in downside momentum. The setup is constructive so long as the 200-SMA holds; a reclaim of the 30.19 50-SMA would confirm a broader momentum shift.
EntryAccumulation zone 27.80–28.20 while price holds the 200-SMA; add-on trigger on a reclaim of 28.75 with MACD crossing positive.
InvalidationDaily close below 27.20 (roughly 2.8% under the 200-SMA) invalidates the inflection thesis and signals the long-term trend line has failed as support.
Targets30.19 (50-SMA / first resistance) → 32.50 (measured extension above the 50-SMA)
TimeframeSwing (2-6 weeks)
Inflection60
Probability83
Quality85
IREN is trading at 46.68, having reclaimed both its 50-SMA (40.38) and 200-SMA (45.54), placing price at a tactical inflection just 2.50% above the long-term trend line where continuation vs. rejection will be decided.
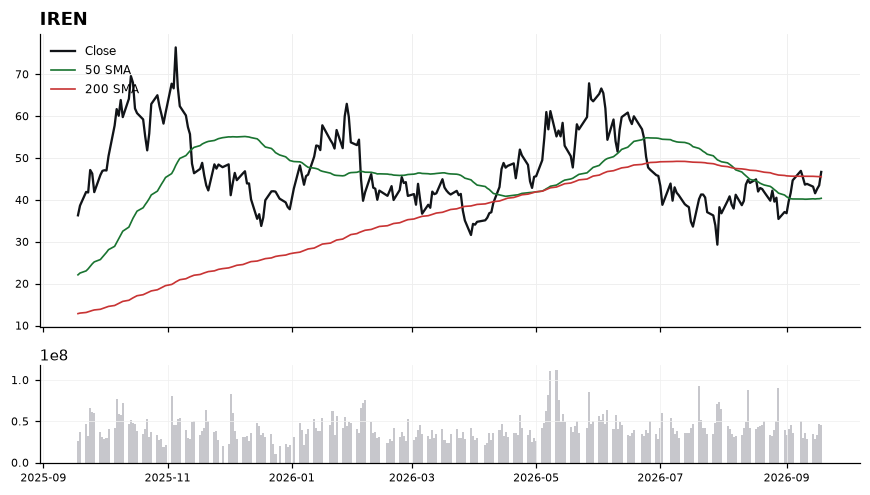
The 50-SMA at 40.38 sits below the 200-SMA at 45.54, so the longer-term structure has not yet formalized a golden cross, but momentum is constructive: RSI at 59.19 is trending in the bullish zone without being overbought, and MACD at 0.90 is above its signal line at 0.55, indicating expanding upside momentum. Price action pressing 2.50% above the 200-SMA suggests the market is testing whether this reclaim holds as new support. Failure to hold above 45.54 would revert the setup to a range-bound bias back toward the 50-SMA at 40.38.
EntryPrefer entries on constructive pullbacks into the 45.54–46.00 zone (200-SMA retest) or on a momentum trigger via a decisive close above 47.50, which would confirm acceptance above the current inflection area.
InvalidationInvalidation on a daily close below 44.50, which would break the 200-SMA reclaim (45.54) and signal the inflection has failed, reopening downside toward the 50-SMA at 40.38.
TargetsFirst target 50.50, an extension roughly 11% above the 200-SMA where momentum trades often see initial supply. → Second target 54.00, a measured continuation objective if MACD momentum persists and RSI pushes toward overbought.
TimeframeSwing (2-6 weeks)
Inflection69
Probability69
Quality85
BITX trades at 18.70, extended above a rising 50-SMA (14.44) and just reclaiming the 200-SMA (18.30) by 2.21%. The reclaim, paired with an RSI of 63.22, marks a potential trend-change inflection, but a MACD (0.83) crossing below its signal (1.01) warns momentum is cooling into the level.
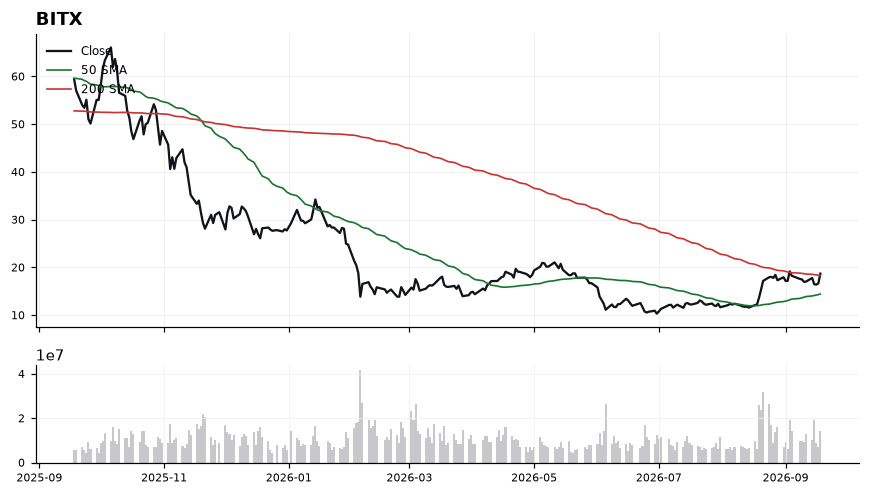
Price sits in a bullish structural regime — 50-SMA (14.44) well below spot and 200-SMA (18.30) now acting as support rather than resistance. RSI at 63.22 confirms upside momentum without hitting overbought (>70), leaving room to extend. However, MACD rolling under its signal line (0.83 vs 1.01) signals near-term deceleration, so the 18.30 level is the pivot that decides whether this becomes a base or a failed breakout. Trade-quality (85.1) and profit-probability (69.0) skew constructive, but the MACD divergence argues for a pullback entry rather than chasing.
EntryPreferred long zone 18.30–18.50 on a controlled retest of the reclaimed 200-SMA; aggressive trigger on a daily close back above 19.00 with MACD re-crossing higher.
InvalidationDaily close below 17.85 (roughly 2.5% under the 200-SMA). Losing this invalidates the reclaim thesis and reopens a drift back toward the 50-SMA at 14.44.
Targets20.40 (prior swing supply, ~9% above spot) → 22.25 (measured extension from the 50/200 SMA base)
TimeframeSwing (2-6 weeks)
Inflection67
Probability64
Quality84
ETHU is trading at 29.59, extended above a rising 50-SMA (20.34) and just reclaiming the 200-SMA (28.57) by 3.55%, marking a potential trend inflection as long-term resistance flips to support.
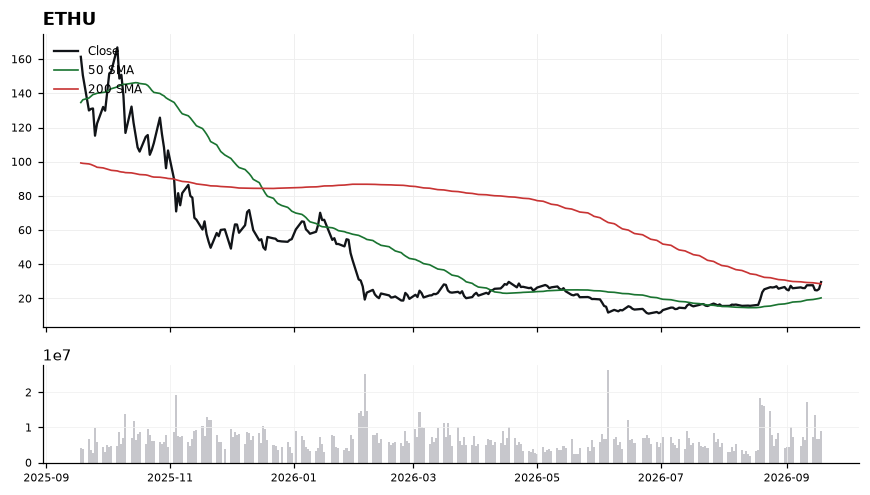
The 50-SMA sits well below the 200-SMA, so the golden-cross setup is still maturing while price leads the structure higher. RSI at 67.65 signals strong momentum but is near overbought, and MACD at 1.92 has slipped below its signal at 2.13, hinting at near-term momentum cooling even as trend remains constructive. With trade-quality scoring 84.3 and technical-inflection at 67.3, the profile favors buying pullbacks toward the 200-SMA rather than chasing strength.
EntryPreferred accumulation zone 28.57–29.00 (200-SMA retest); secondary trigger on a reclaim and daily close back above 30.00 with MACD crossing back above signal.
InvalidationDaily close below 27.75 (roughly 3% under the 200-SMA); breaking it negates the 200-SMA reclaim and reopens downside toward the 50-SMA gap.
Targets32.50 — measured extension from the 200-SMA reclaim → 35.00 — prior structural swing zone and momentum target
TimeframeSwing (2-6 weeks)
Ranked by technical inflection, profit-probability, and trade quality. Educational only. Not financial advice.