Wednesday Playbook — Top 5 Setups

The day's five highest-conviction setups, ranked by technical inflection, profit-probability, and trade quality — 5 long, 0 short. Trade your plan and manage risk first. Also screened: $SPY, $ALGN, $GOOGL, $QQQ, $HIMS, $IGV.

1$FSLRHotLongMedium convictionscore 77
Inflection69
Probability83
Quality80

FSLR is coiling just above its 200-SMA (234.26) while still trading below its 50-SMA (244.54), setting up a classic inflection where a reclaim of the 50-day would confirm trend repair on the Long bias.
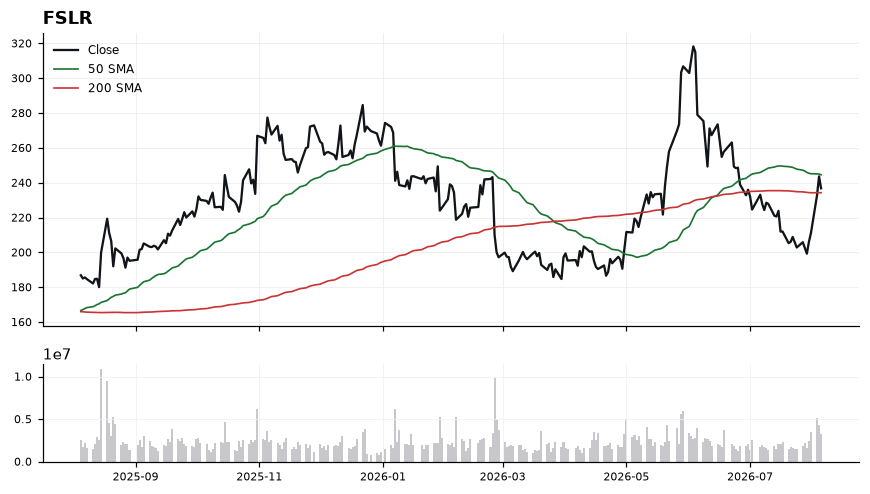
FSLR chart with 50 and 200 day moving averages

Price at 236.80 sits only 1.08% above the 200-SMA, making that level the line-in-the-sand support. RSI at 58.08 shows constructive momentum without being overbought, and MACD at -2.55 vs signal -7.75 reflects a clear bullish crossover with momentum inflecting higher. The tension between price under the 50-SMA (244.54) and improving momentum defines the setup: a break above 244.54 would flip trend structure, while a loss of 234.26 would negate it.

EntryAccumulation zone 234.50–237.50 near the 200-SMA, with a confirmation add on a decisive close above the 50-SMA at 244.54.
InvalidationBelow 230.00 (roughly 2% under the 200-SMA); a break there invalidates the reclaim thesis and signals the 200-SMA has flipped from support to resistance.
TargetsFirst target 244.50 at the 50-SMA — the immediate overhead resistance → Second target 258.00–262.00, prior swing zone once the 50-SMA is reclaimed
TimeframeSwing (2-6 weeks)
2$HDTradedLongMedium convictionscore 77
Inflection65
Probability83
Quality86

HD is trading at 353.14, above both its 50-SMA (333.05) and 200-SMA (348.51), with the recent reclaim of the long-term trend line marking an inflection point for the working long bias.

HD chart with 50 and 200 day moving averages

Price sits just 1.33% above the 200-SMA, indicating a fresh trend reclaim rather than an extended move, while the 50-SMA at 333.05 has curled up beneath as dynamic support. RSI at 60.83 confirms constructive momentum without reaching overbought territory, leaving room for continuation. MACD at 2.27 over its signal at 1.12 shows a widening positive spread, corroborating the upside bias. Trade-quality (85.7) and profit-probability (83.0) scores reinforce the setup, though inflection score of 65.1 suggests measured, not explosive, follow-through.

EntryPrefer staged entries on pullbacks into the 348.50–350.00 zone (retest of the 200-SMA); a momentum add can be considered on a decisive close above 355.00.
InvalidationInvalidation on a daily close below 344.00; breaking that level would forfeit the 200-SMA reclaim and signal the long thesis has failed.
TargetsFirst target 365.00, a measured extension from the reclaim zone → Second target 375.00, projecting continuation of the trend above the rising 50-SMA
TimeframeSwing (2-6 weeks)
3$POETTradedLongMedium convictionscore 74
Inflection60
Probability83
Quality85

POET is coiling just above its 200-SMA (7.91) after a pullback from the 50-SMA (10.04), setting up a classic mean-reversion inflection with the working long bias sitting only 2.27% above key trend support.

POET chart with 50 and 200 day moving averages

Price at 8.09 is sandwiched between rising 200-SMA support at 7.91 and 50-SMA resistance at 10.04, defining a clear ~26% range for the swing. RSI at 48.6 is neutral but curling up from oversold territory, while MACD at -0.61 has crossed above its signal at -0.84, an early momentum inflection consistent with the 60.1 inflection score. The proximity to the 200-SMA (2.27%) offers a tight, well-defined risk anchor, which underpins the elevated 83.0 profit-probability and 85.1 trade-quality reads. Confirmation still requires price to hold the 200-SMA and reclaim intermediate structure.

EntryAccumulate on strength between 8.10–8.30 with confirmation on a reclaim of 8.50; alternatively, bid a controlled retest of the 200-SMA in the 7.92–8.00 zone.
InvalidationDaily close below 7.75 (roughly 2% under the 200-SMA); a break there invalidates the trend-support thesis and shifts bias back to neutral/short.
TargetsFirst target 9.20 — mid-range mean reversion toward the gap between the SMAs → Second target 10.00 — tag of the 50-SMA resistance at 10.04
TimeframeSwing (2-6 weeks)
4$PLTRHotLongMedium convictionscore 72
Inflection62
Probability78
Quality78

PLTR at 158.43 is riding a firm uptrend with the 50-SMA (131.42) stacked well above the 200-SMA (152.44), and price extended 3.93% above the 200-day. The inflection is a momentum-continuation setup where trade-quality (78) and profit-probability (78) align, but an RSI of 68.74 signals the tape is approaching overbought and needs a controlled pullback to reload.

PLTR chart with 50 and 200 day moving averages

MACD at 3.55 versus a 0.28 signal line confirms strong, expanding upside momentum, while price holds a clean premium to both moving averages. RSI 68.74 is bullish but within striking distance of the 70 threshold, suggesting reward/risk is better on dips than on breakouts. The 200-SMA at 152.44 is the structural pivot, with the 50-SMA at 131.42 as the deeper trend floor. Technical-inflection score of 61.7 reflects a trend in motion rather than a fresh base breakout, so tactical entry discipline matters.

EntryPreferred entry on a pullback into 153.50–155.50 (just above the 200-SMA at 152.44); alternative momentum trigger on a decisive close back above 159.00 after any shallow dip.
InvalidationDaily close below 150.50 (under the 200-SMA at 152.44) invalidates the long thesis, signaling loss of the trend pivot and a likely transition toward the 50-SMA at 131.42.
TargetsFirst target 165.50 — measured continuation above current highs → Second target 173.00 — extension zone if momentum broadens
TimeframeSwing (2-6 weeks)
5$ETORTradedLongMedium convictionscore 71
Inflection63
Probability69
Quality86

ETOR is trading above its 200-day (+1.1%) with the 50/200-day structure aligned — a defined technical decision point.

ETOR chart with 50 and 200 day moving averages

ETOR is trading above its 200-day SMA (+1.1%). The 50-day is above the 200-day, a bullish structure. RSI(14) at 43 is neutral. Bias: Long. Key level to watch is the 200-day near 35.72.

EntryLong on a reclaim of 38.55 (50-day).
InvalidationInvalidation below 35.00
Targets38.55 → 40.87
TimeframeSwing (2-6 weeks)

Ranked by technical inflection, profit-probability, and trade quality. Educational only. Not financial advice.

Wednesday Playbook — Top 5 Setups — Daily Playbook