Tuesday Playbook — Top 5 Setups

The day's five highest-conviction setups, ranked by technical inflection, profit-probability, and trade quality — 3 long, 0 short. Trade your plan and manage risk first. Also screened: $SMCI, $IGV, $QQQ, $GOOGL, $HIMS, $QCOM.

1$FSLRHotLongMedium convictionscore 74
Inflection62
Probability83
Quality78

FSLR is coiling at its 50-day SMA (244.96) while holding 4.00% above the rising 200-day SMA (234.27), with a bullish MACD cross (-4.42 vs signal -9.04) suggesting momentum is inflecting higher after a downtrend.
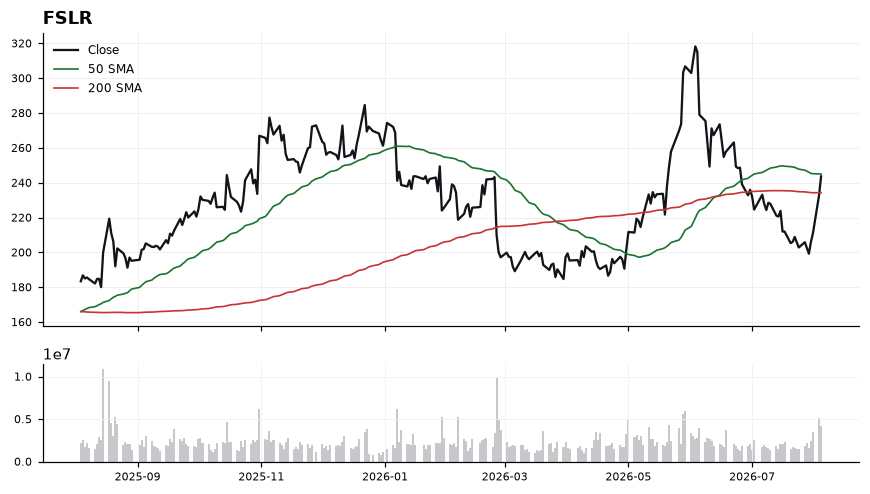
FSLR chart with 50 and 200 day moving averages

Price at 243.63 is pinned just below the 50-SMA (244.96), making that line the immediate pivot; a reclaim would confirm the momentum shift already flagged by MACD narrowing sharply toward zero. RSI at 62.87 shows building strength without yet reaching overbought territory, leaving room for continuation. The 200-SMA at 234.27 defines the structural floor, and the 4.00% cushion above it aligns with a constructive medium-term backdrop. Failure to clear 244.96 keeps the tape in a tactical chop zone between the two moving averages.

EntryAccumulate on strength above 245.00 (50-SMA reclaim), or on a pullback into the 236.00-238.00 zone that holds the 200-SMA at 234.27.
InvalidationDaily close below 232.00; breaking the 200-SMA (234.27) would invalidate the long thesis and flip trend structure back to neutral/negative.
Targets258.00 — prior swing resistance and first measured extension off the MACD cross → 272.00 — extended target if momentum expands and RSI pushes into the 70s
TimeframeSwing (2-6 weeks)
2$NVDAMAG7LongMedium convictionscore 72
Inflection38
Probability98
Quality87

NVDA trades at 211.94, holding above both the 50-SMA (205.69) and 200-SMA (193.41) with a bullish MACD crossover (-0.41 vs signal -0.93) forming below zero — an early-inflection setup where momentum is turning up while price sits 9.58% above its long-term trend.

NVDA chart with 50 and 200 day moving averages

Price structure is constructive: the 50-SMA has cleared the 200-SMA and price rides above both, defining a stacked uptrend. RSI at 56.93 is mid-range, leaving room to run before overbought conditions while confirming positive momentum. The MACD histogram improving toward a zero-line cross is the fresh signal, though the 38.4 technical-inflection score suggests the move is developing, not yet extended. The 9.58% cushion to the 200-SMA is healthy but not stretched, keeping trend-following risk/reward workable.

EntryPrefer staged entries on pullbacks toward the 50-SMA at 205.69–207.50, or a momentum trigger on a reclaim/hold above 213.00 on strong closes.
InvalidationInvalidation on a daily close below 202.50 (under the 50-SMA); a break there signals loss of intermediate trend support and opens a retest of the 193.41 200-SMA.
TargetsFirst target 220.00–222.00, prior supply zone and measured extension from the current base → Second target 230.00, trend-continuation objective if MACD crosses above zero with RSI holding >60
TimeframeSwing (2-6 weeks)
3$PLTRHotWatchMedium convictionscore 68
Inflection55
Probability78
Quality76

PLTR is trading at 162.66, extended 6.64% above its rising 200-SMA (152.54) and 24% above its 50-SMA (130.99), with momentum firmly bullish but RSI at 72.80 flagging an overbought tape. This creates a watch setup where the trend is intact but the risk/reward favors patience for a controlled pullback rather than chasing strength.

PLTR chart with 50 and 200 day moving averages

The 50-SMA at 130.99 crossing well below price and the 200-SMA at 152.54 confirms a stacked bullish structure, and MACD at 1.52 versus a signal of -0.54 shows a decisive positive momentum spread. However, RSI of 72.80 sits in classic overbought territory, historically a zone where near-term mean reversion risk rises. First reference support aligns with the 200-SMA at 152.54, with deeper structural support at the 50-SMA near 130.99. The 78.0 profit-probability score paired with a moderate 55.2 inflection score argues the trend is strong but timing entry into an extended move is the challenge.

EntryPrefer staged entries on a pullback: initial tranche 155–158 (near breakout retest), add-on tranche 152.50–153.50 into the 200-SMA. Avoid chase entries above 165 unless RSI resets below 65 on consolidation.
InvalidationDaily close below 148.50 (roughly 2.6% under the 200-SMA). Breaking this invalidates the trend-retest thesis and signals the extended move is transitioning to distribution rather than a healthy pullback.
TargetsFirst target 172.50 — retest of prior highs zone and measured extension from the 50/200-SMA base → Second target 182.00 — trend-continuation objective if momentum expands on above-average follow-through
TimeframeSwing (2-6 weeks)
4$SPYTradedLongMedium convictionscore 68
Inflection39
Probability93
Quality80

SPY is extending a mature uptrend at 771.33, riding well above both its 50-SMA (745.89) and 200-SMA (701.39). The inflection is a momentum-versus-extension question: MACD has expanded to 2.56 over its 0.55 signal while RSI at 66 sits just under overbought, and price is 9.97% above the 200-SMA — a stretched but still-trending posture.

SPY chart with 50 and 200 day moving averages

Trend structure is unambiguously constructive: the 50-SMA sits ~6.3% above the 200-SMA and price is above both, confirming a stacked bullish alignment. MACD's ~2.0-point spread above its signal line signals accelerating momentum, though RSI at 66 warns that room to run before a stall is narrowing. The 9.97% distance to the 200-SMA is the key risk-reward tension — historically, extensions of this magnitude either consolidate sideways or shake back toward the 50-SMA before continuation. Trade-quality (80) and profit-probability (93) are strong, but the low inflection score (38.6) argues this is a continuation posture, not a fresh breakout.

EntryPrefer add-on entries on a pullback into the 758-746 zone (near the 50-SMA at 745.89) rather than chasing at 771.33; a momentum trigger on a decisive close above 775 could justify a reduced-size continuation entry.
InvalidationInvalidation on a daily close below 744 (through the 50-SMA at 745.89). Losing that level would break the shorter-term trend shelf and open a drift toward the 200-SMA, flipping the working bias.
Targets785 — measured extension of the current MACD impulse → 798-800 — round-number magnet and next psychological resistance
TimeframeSwing (2-6 weeks)
5$CRWVAI InfrastructureWatchMedium convictionscore 67
Inflection63
Probability61
Quality80

CRWV is coiling just below its 50-SMA (93.13) and 200-SMA (94.35) with price at 91.90, sitting -2.59% under the long-term trend line. The setup is inflecting because MACD (-3.95) has crossed above its signal (-6.27) and RSI (56.95) is firming into bullish territory, signaling momentum is turning even as price remains capped by overhead moving averages.

CRWV chart with 50 and 200 day moving averages

Price action is compressed inside a narrow band between 91.90 and the confluence resistance at 93.13-94.35, where both SMAs stack as a decision zone. The MACD improvement of ~2.3 points above signal confirms downside momentum is fading, while an RSI reading near 57 shows buyers stepping in without being overextended. However, until price reclaims the 200-SMA at 94.35, the broader trend remains neutral-to-defensive, justifying a Watch bias rather than active accumulation. A trade-quality score of 80.3 flags this as a high-grade setup once triggered.

EntryTrigger on a confirmed close above 94.35 (200-SMA reclaim), with a preferred entry zone of 94.40-95.00; alternatively, a pullback tag of 90.00-90.50 that holds could offer a lower-risk long against structure.
InvalidationInvalidation on a daily close below 89.50; breaking this level would negate the MACD improvement, likely flip RSI back below 50, and signal continuation of the sub-200-SMA downtrend.
TargetsFirst target 98.50, a ~4.4% move that clears the 50/200-SMA cluster and captures the initial mean-reversion leg → Second target 103.00, extending the swing to ~9% and aligning with a fuller momentum thrust if MACD crosses zero
TimeframeSwing (2-6 weeks)

Ranked by technical inflection, profit-probability, and trade quality. Educational only. Not financial advice.