Price sits 2.92% above the 200-SMA and roughly 4.8% above the 50-SMA, confirming a positive slope handoff between short- and long-term trend proxies. RSI at 64.38 shows strong momentum without yet triggering overbought (>70), leaving room for continuation but flagging near-term extension risk. The MACD spread of +0.55 over signal reflects accelerating momentum, while the 50-SMA crossing back toward the 200-SMA marks a mean-reversion-to-trend inflection. Trade-quality (79.1) and profit-probability (83.0) reinforce a constructive but not chase-worthy setup.
Monday Playbook — Top 5 Setups
The day's five highest-conviction setups, ranked by technical inflection, profit-probability, and trade quality — 5 long, 0 short. Trade your plan and manage risk first. Also screened: $AVGO, $HIMS, $NVDA, $HD, $COST, $ALGN.
Inflection62
Probability83
Quality79
IGV is trading at 97.42, extended above both the 50-SMA (92.97) and 200-SMA (94.65) with MACD (0.56) firmly above signal (0.01), marking a bullish inflection as the trend structure re-aligns from below to above the long-term mean.
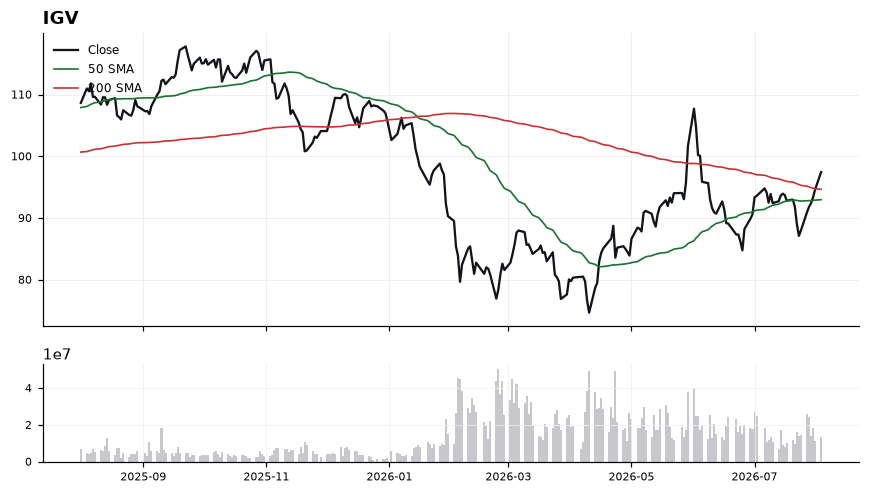
EntryPreferred entry on a controlled pullback into the 94.65–95.50 zone (200-SMA confluence); secondary trigger on a decisive close above 98.00 confirming breakout continuation.
InvalidationInvalidation on a close below 92.97 (50-SMA); breaking this level would negate the momentum thrust and reopen downside toward the prior base.
Targets100.50 — round-number resistance and measured extension from the 200-SMA reclaim → 104.00 — trend continuation objective consistent with current MACD slope
TimeframeSwing (2-6 weeks)
Inflection50
Probability98
Quality70
MDB is trading at 357.97, roughly 7.3% above the 200-SMA (333.60) and above the 50-SMA (335.85), with the 50 having crossed back over the 200 — a constructive posture that puts the tape at an inflection as momentum accelerates off a deep MACD trough.
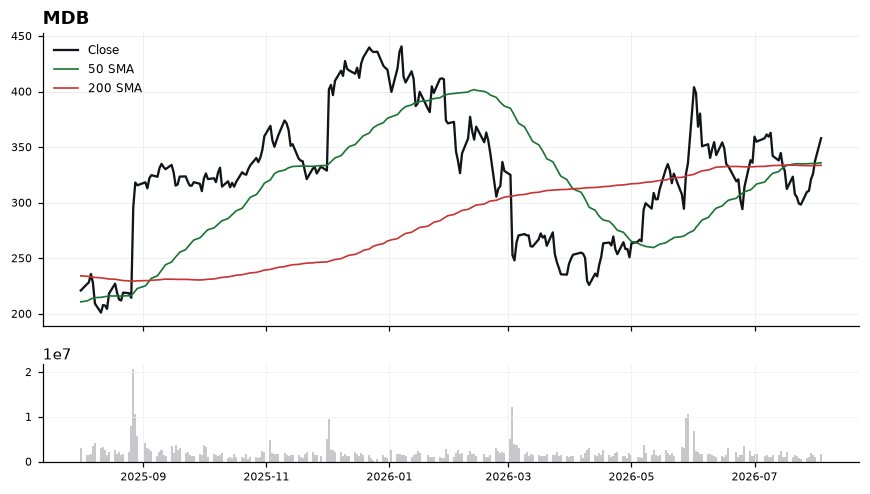
RSI(14) at 62.04 shows firm but not yet overbought momentum, leaving room to extend before hitting the 70 threshold. MACD at -0.81 versus signal -4.18 confirms a decisive bullish crossover from negative territory — an early-stage momentum turn rather than a mature one. Price is holding well above both the 50-SMA (335.85) and 200-SMA (333.60), which now stack as tiered support only ~6-7% below spot. The 22-point gap between price and the 50-SMA suggests the move is extended short-term, favoring pullback entries over chase entries.
EntryPreferred accumulation zone 345-350 on a pullback toward the rising 50-SMA (335.85); alternatively, a momentum add on a clean reclaim/close above 362-365 that confirms breakout continuation.
InvalidationDaily close below 333 (under the 200-SMA at 333.60) invalidates the long thesis — it would negate the 50/200 alignment and signal the MACD cross is failing.
TargetsFirst target 378-382, prior resistance shelf and a natural momentum extension roughly 6-7% above spot → Second target 398-405, measured move from the 50/200 base zone
TimeframeSwing (2-6 weeks)
Inflection41
Probability98
Quality81
SPY is trading at 757.67, holding above both its 50-SMA (745.32) and 200-SMA (700.86) with a bullish MACD crossover (0.47 vs 0.05). The setup sits at an inflection as RSI at 59.5 approaches overbought territory while price extends 8.11% above the long-term trend anchor.
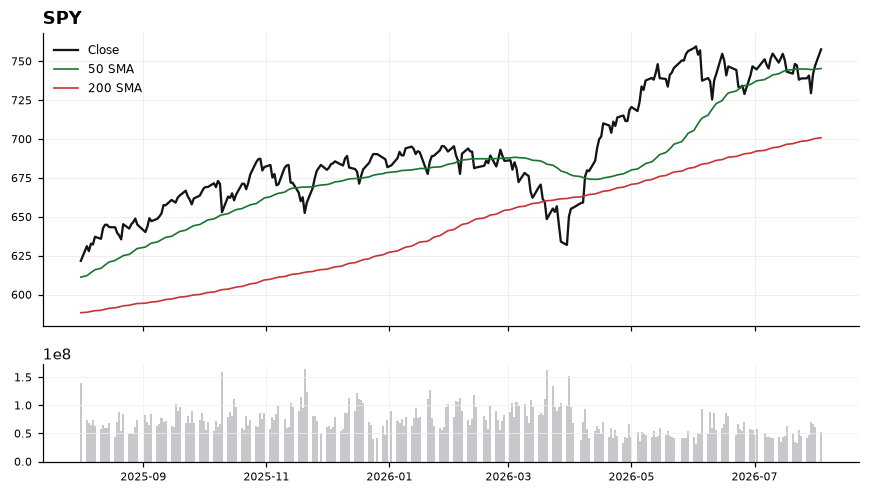
The trend structure remains constructive: price is 1.66% above the rising 50-SMA and the MACD histogram is positive, confirming upside momentum. RSI at 59.5 leaves room before the 70 threshold, but the 8.11% gap to the 200-SMA suggests the tape is stretched versus its long-term mean. The 50-SMA at 745.32 is the pivotal near-term shelf; a hold there preserves the uptrend, while a loss would open air down toward the 200-SMA.
EntryPrefer staged longs on pullbacks into 750-746 (near the 50-SMA at 745.32); a breakout close above 760 can serve as a momentum add trigger.
InvalidationDaily close below 743 (under the 50-SMA at 745.32); breaking this level negates the short-term uptrend and shifts bias toward a mean-reversion move back toward the 200-SMA at 700.86.
Targets762-766 range extension on continuation → 775-780 measured move if momentum persists
TimeframeSwing (2-6 weeks)
Inflection60
Probability69
Quality85
ETOR is coiling between its rising 200-SMA (35.74) and declining 50-SMA (38.70), sitting just 1.91% above long-term trend support — a classic inflection zone where the working long bias needs a reclaim to activate.
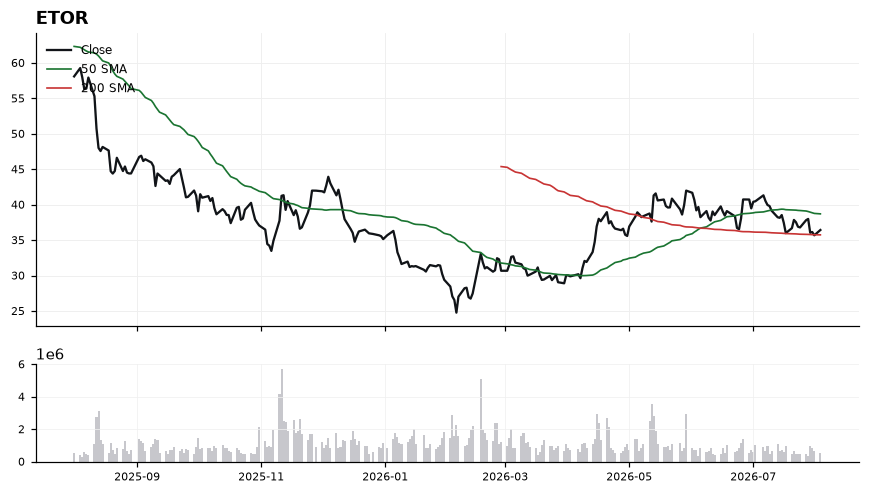
Price at 36.42 is trapped below the 50-SMA (38.70) but holding above the 200-SMA (35.74), signaling short-term weakness inside a broader uptrend. RSI at 43.37 is neutral-to-soft, leaving room to rally without being stretched, while MACD at -0.72 versus signal -0.56 confirms downside momentum has not yet exhausted. The setup favors patience: a reclaim of the 50-SMA would flip the tape, while a loss of the 200-SMA would invalidate the constructive structure.
EntryTiered accumulation: initial zone 35.90–36.50 on stabilization near the 200-SMA; add-on trigger on a reclaim and close above 38.70 (50-SMA).
InvalidationDaily close below 35.00 — a decisive break beneath the 200-SMA (35.74) would invalidate the long thesis and signal trend transition.
Targets38.70 — reversion to the 50-SMA and first supply shelf → 41.00–41.50 — extension above the 50-SMA reclaim, prior swing area
TimeframeSwing (2-6 weeks)
Inflection61
Probability69
Quality79
W is trading at 89.31, holding above both the 50-SMA (83.44) and 200-SMA (87.38) after reclaiming the long-term trend line, positioning the tape at an inflection where a stabilization above 87.38 could extend the recovery.
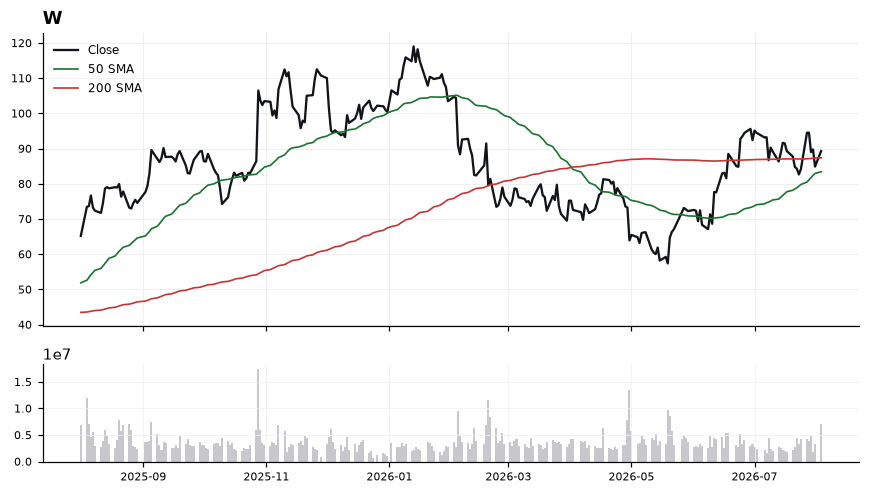
Price sits just 2.20% above the 200-SMA, with the 50-SMA (83.44) rising underneath and offering trend support. RSI at 52.49 is neutral-constructive, leaving room to run before overbought conditions, but MACD at 1.03 has crossed below its signal at 1.52, flagging near-term momentum cooling. The structure favors a long bias only while 87.38 holds; loss of that level would tilt the read back to range.
EntryAccumulate on pullbacks into the 87.40-88.20 zone (retest of the 200-SMA); alternatively, trigger on a reclaim and hourly close above 90.00 to confirm momentum re-acceleration.
InvalidationBelow 83.20 (under the 50-SMA). A break there invalidates the trend-reclaim thesis and signals a return to the prior sub-200-SMA regime.
Targets93.50 — measured extension from the 200-SMA reclaim → 98.00 — prior swing supply / next volatility node
TimeframeSwing (2-6 weeks)
Ranked by technical inflection, profit-probability, and trade quality. Educational only. Not financial advice.