XRP Daily Playbook
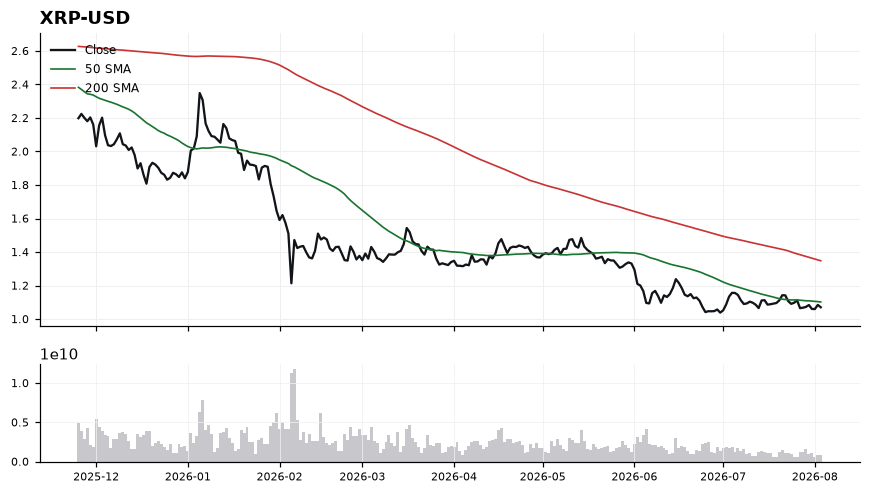
XRP is trading at 1.09, essentially pinned to its 50-SMA at 1.10 while sitting 19.70% below the 200-SMA at 1.35 — a classic bearish structure where the shorter average has yet to reclaim the longer-term trend line. RSI at 48.09 is neutral-to-slightly-soft, and MACD hugging its signal line near -0.01 confirms momentum is flat rather than directional, so price action around 1.10 becomes the tell. Immediate resistance stacks at the 50-SMA (1.10), with the 1.35 200-SMA as the larger structural ceiling; on the downside, losing 1.09 opens air toward recent range lows where dip-buyers previously stepped in. The setup of interest is a decisive reclaim and hold above 1.10 with MACD crossing positive — that would shift the near-term bias and put a test of the gap toward 1.35 on the table. Conversely, rejection at 1.10 followed by RSI slipping under 45 keeps sellers in control and invalidates any bullish attempt. Thesis is wrong if XRP closes back below the recent range floor with expanding downside momentum, confirming the 200-SMA downtrend remains firmly intact.