SOL Daily Playbook
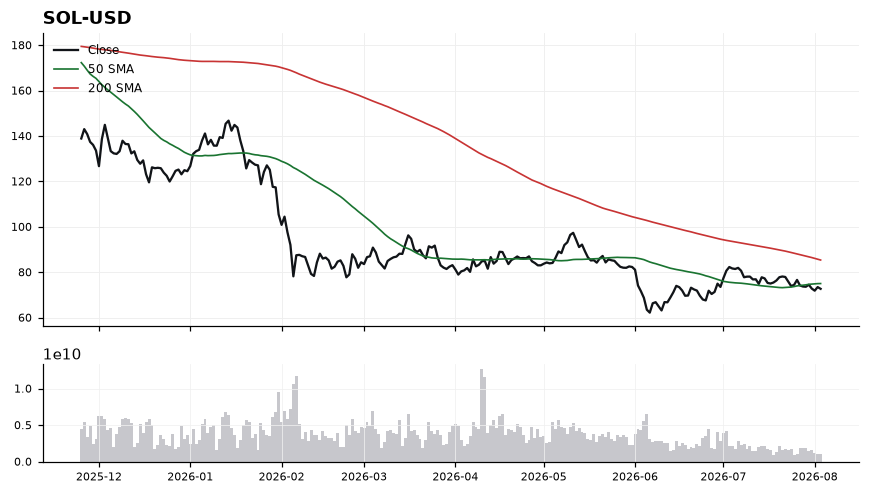
Solana is trading at 73.58, pinned below both its 50-SMA (74.98) and 200-SMA (85.71), keeping the intermediate trend bearish with price sitting 14.16% under the long-term average — a classic downtrend structure. Momentum confirms the caution: MACD at -0.82 is below its signal at -0.44 and still widening lower, while RSI at 45.50 is neutral-soft, leaving room for further downside without being oversold. The immediate ceiling is the 50-SMA at 74.98; reclaiming and holding above it would open a path toward retesting the 200-SMA near 85.71, where trend-defining supply likely rests. On the downside, failure to defend the recent low base risks accelerating losses, so bulls need a MACD cross back above signal plus a close above 74.98 as the trigger for any mean-reversion setup. The bearish thesis is invalidated on a decisive daily close above the 50-SMA with RSI pushing through 55; conversely, sustained trade below the recent swing lows would confirm trend continuation and negate any reversal attempt.