ETH Daily Playbook
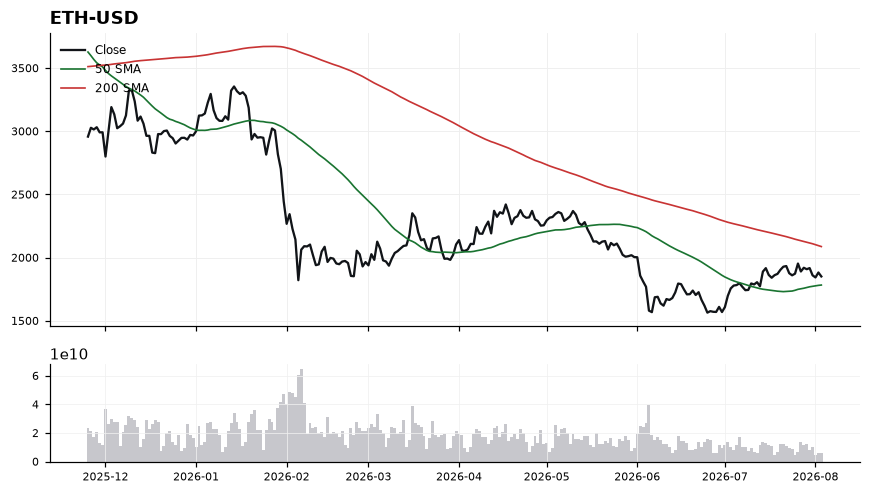
Ether is trading at 1,882.54, wedged between a rising 50-SMA at 1,780.70 (bullish short-term structure) and a still-declining 200-SMA at 2,095.21, leaving price 10.15% below its long-term trend — a classic recovery-in-a-downtrend posture. Momentum is neutral-to-mildly constructive: RSI at 53.08 sits above the midline but shows no thrust, while MACD at 24.81 has slipped under its signal at 33.75, hinting the recent impulse is cooling. Immediate support stacks at the 50-SMA near 1,780 (loss of this flips the near-term bias); overhead, the 200-SMA around 2,095 is the pivotal resistance that would need to be reclaimed for trend repair. The actionable setup is a range read: buyers regaining control on holds above ~1,880 with RSI curling back over 55 and MACD re-crossing its signal would keep the path toward the 200-day open, while a rejection here that pushes RSI back under 50 argues for a retest of the 50-SMA shelf. Invalidation for the constructive case is a decisive daily close below 1,780; invalidation for bears is a sustained reclaim of 2,095.